Slavic vs Immigrants from Czechoslovakia Births to Unmarried Women
COMPARE
Slavic
Immigrants from Czechoslovakia
Births to Unmarried Women
Births to Unmarried Women Comparison
Slavs
Immigrants from Czechoslovakia
31.6%
BIRTHS TO UNMARRIED WOMEN
52.0/ 100
METRIC RATING
169th/ 347
METRIC RANK
28.4%
BIRTHS TO UNMARRIED WOMEN
98.8/ 100
METRIC RATING
65th/ 347
METRIC RANK
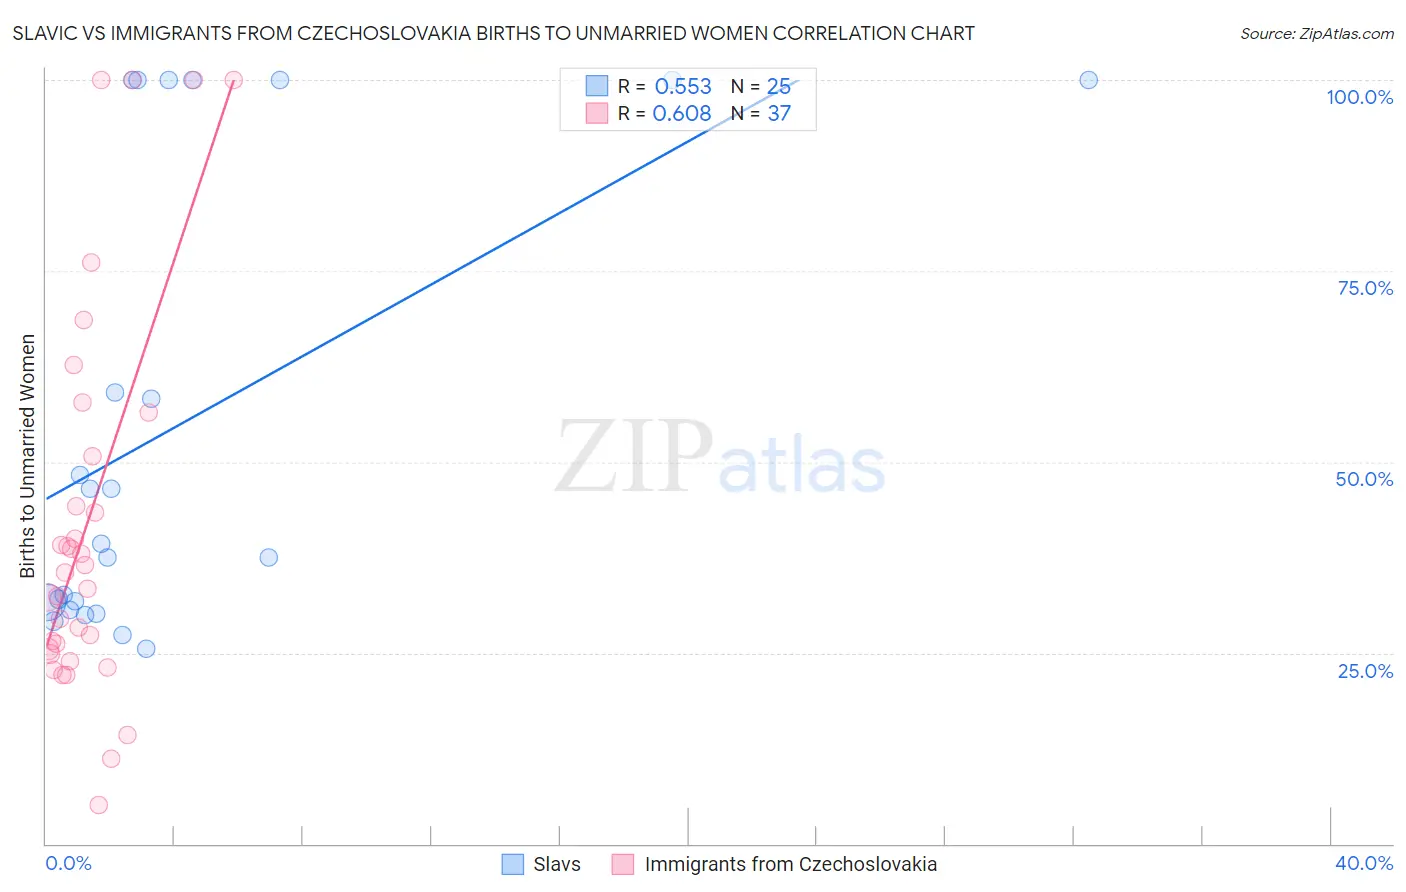
Slavic vs Immigrants from Czechoslovakia Births to Unmarried Women Correlation Chart
The statistical analysis conducted on geographies consisting of 254,358,438 people shows a substantial positive correlation between the proportion of Slavs and percentage of births to unmarried women in the United States with a correlation coefficient (R) of 0.553 and weighted average of 31.6%. Similarly, the statistical analysis conducted on geographies consisting of 184,731,208 people shows a significant positive correlation between the proportion of Immigrants from Czechoslovakia and percentage of births to unmarried women in the United States with a correlation coefficient (R) of 0.608 and weighted average of 28.4%, a difference of 11.4%.
Births to Unmarried Women Correlation Summary
| Measurement | Slavic | Immigrants from Czechoslovakia |
| Minimum | 25.6% | 5.1% |
| Maximum | 100.0% | 100.0% |
| Range | 74.4% | 94.9% |
| Mean | 54.9% | 42.1% |
| Median | 39.3% | 35.5% |
| Interquartile 25% (IQ1) | 31.1% | 25.2% |
| Interquartile 75% (IQ3) | 100.0% | 53.6% |
| Interquartile Range (IQR) | 68.9% | 28.5% |
| Standard Deviation (Sample) | 29.9% | 25.4% |
| Standard Deviation (Population) | 29.3% | 25.1% |
Similar Demographics by Births to Unmarried Women
Demographics Similar to Slavs by Births to Unmarried Women
In terms of births to unmarried women, the demographic groups most similar to Slavs are Belgian (31.6%, a difference of 0.030%), Guamanian/Chamorro (31.6%, a difference of 0.070%), Finnish (31.7%, a difference of 0.14%), Immigrants from Eritrea (31.7%, a difference of 0.15%), and Immigrants from Yemen (31.7%, a difference of 0.17%).
| Demographics | Rating | Rank | Births to Unmarried Women |
| Slovenes | 65.9 /100 | #162 | Good 31.2% |
| Immigrants | Chile | 65.7 /100 | #163 | Good 31.2% |
| Hungarians | 64.1 /100 | #164 | Good 31.2% |
| Immigrants | Somalia | 58.1 /100 | #165 | Average 31.4% |
| Peruvians | 55.5 /100 | #166 | Average 31.5% |
| Dutch | 55.3 /100 | #167 | Average 31.5% |
| Belgians | 52.4 /100 | #168 | Average 31.6% |
| Slavs | 52.0 /100 | #169 | Average 31.6% |
| Guamanians/Chamorros | 51.3 /100 | #170 | Average 31.6% |
| Finns | 50.5 /100 | #171 | Average 31.7% |
| Immigrants | Eritrea | 50.4 /100 | #172 | Average 31.7% |
| Immigrants | Yemen | 50.2 /100 | #173 | Average 31.7% |
| Venezuelans | 50.0 /100 | #174 | Average 31.7% |
| Immigrants | Venezuela | 49.2 /100 | #175 | Average 31.7% |
| Scottish | 48.1 /100 | #176 | Average 31.7% |
Demographics Similar to Immigrants from Czechoslovakia by Births to Unmarried Women
In terms of births to unmarried women, the demographic groups most similar to Immigrants from Czechoslovakia are Tongan (28.4%, a difference of 0.020%), Immigrants from Egypt (28.4%, a difference of 0.020%), Palestinian (28.4%, a difference of 0.13%), Immigrants from Europe (28.4%, a difference of 0.18%), and Bolivian (28.5%, a difference of 0.22%).
| Demographics | Rating | Rank | Births to Unmarried Women |
| Immigrants | Albania | 99.2 /100 | #58 | Exceptional 28.0% |
| Immigrants | Kazakhstan | 99.1 /100 | #59 | Exceptional 28.1% |
| Immigrants | Turkey | 99.1 /100 | #60 | Exceptional 28.1% |
| Immigrants | North Macedonia | 99.1 /100 | #61 | Exceptional 28.1% |
| Egyptians | 99.0 /100 | #62 | Exceptional 28.2% |
| Immigrants | Serbia | 98.9 /100 | #63 | Exceptional 28.3% |
| Tongans | 98.8 /100 | #64 | Exceptional 28.4% |
| Immigrants | Czechoslovakia | 98.8 /100 | #65 | Exceptional 28.4% |
| Immigrants | Egypt | 98.8 /100 | #66 | Exceptional 28.4% |
| Palestinians | 98.7 /100 | #67 | Exceptional 28.4% |
| Immigrants | Europe | 98.7 /100 | #68 | Exceptional 28.4% |
| Bolivians | 98.7 /100 | #69 | Exceptional 28.5% |
| Laotians | 98.6 /100 | #70 | Exceptional 28.5% |
| Jordanians | 98.5 /100 | #71 | Exceptional 28.5% |
| Immigrants | Sweden | 98.5 /100 | #72 | Exceptional 28.5% |