Scottish vs Zimbabwean Single Female Poverty
COMPARE
Scottish
Zimbabwean
Single Female Poverty
Single Female Poverty Comparison
Scottish
Zimbabweans
21.8%
SINGLE FEMALE POVERTY
7.3/ 100
METRIC RATING
223rd/ 347
METRIC RANK
19.5%
SINGLE FEMALE POVERTY
99.0/ 100
METRIC RATING
87th/ 347
METRIC RANK
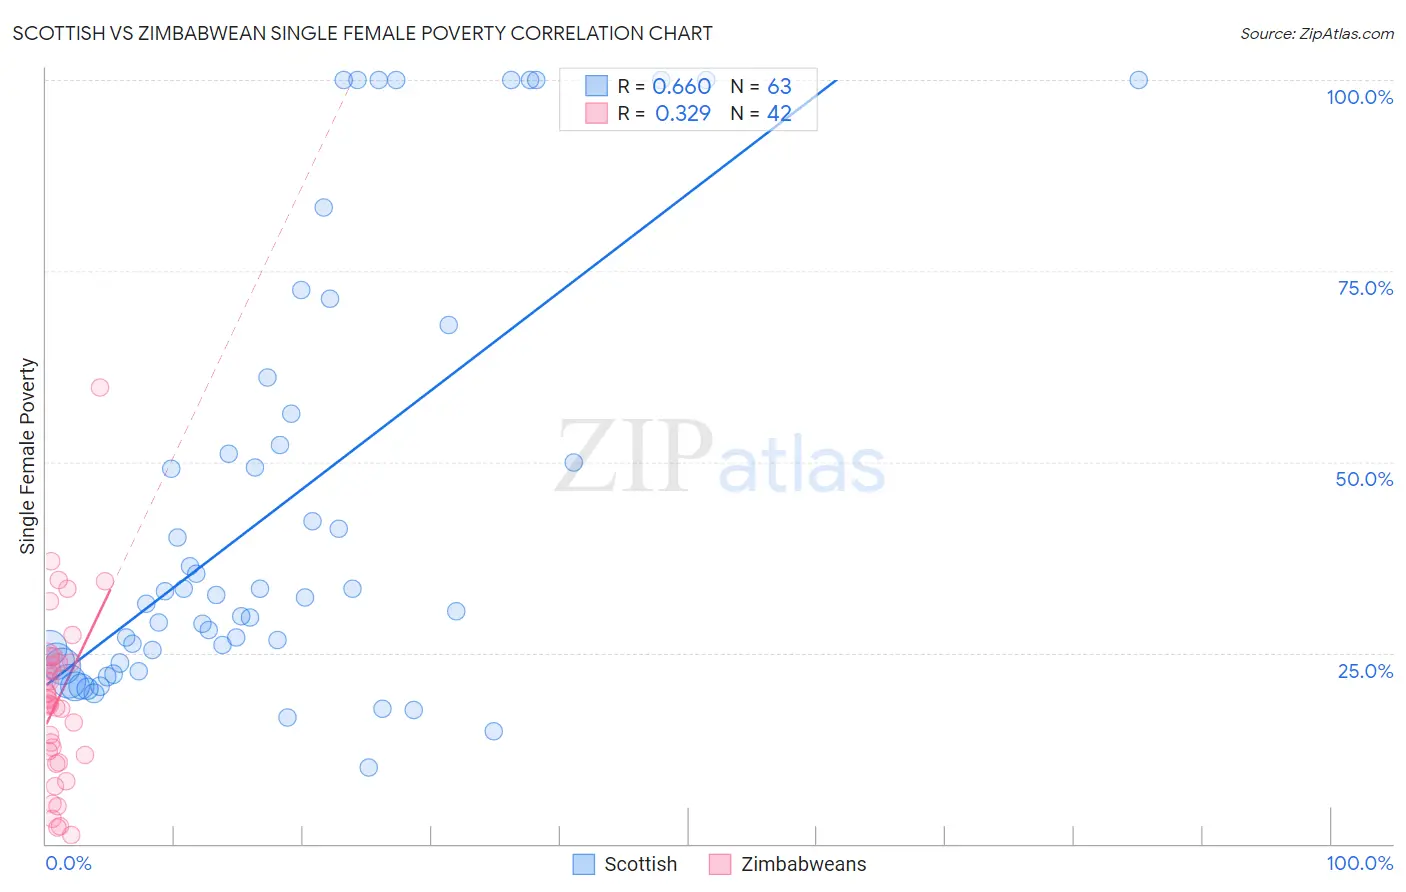
Scottish vs Zimbabwean Single Female Poverty Correlation Chart
The statistical analysis conducted on geographies consisting of 546,834,351 people shows a significant positive correlation between the proportion of Scottish and poverty level among single females in the United States with a correlation coefficient (R) of 0.660 and weighted average of 21.8%. Similarly, the statistical analysis conducted on geographies consisting of 69,078,290 people shows a mild positive correlation between the proportion of Zimbabweans and poverty level among single females in the United States with a correlation coefficient (R) of 0.329 and weighted average of 19.5%, a difference of 11.9%.
Single Female Poverty Correlation Summary
| Measurement | Scottish | Zimbabwean |
| Minimum | 10.0% | 1.1% |
| Maximum | 100.0% | 59.7% |
| Range | 90.0% | 58.6% |
| Mean | 44.2% | 18.9% |
| Median | 32.2% | 18.6% |
| Interquartile 25% (IQ1) | 23.7% | 11.6% |
| Interquartile 75% (IQ3) | 56.2% | 23.8% |
| Interquartile Range (IQR) | 32.6% | 12.2% |
| Standard Deviation (Sample) | 28.5% | 11.3% |
| Standard Deviation (Population) | 28.3% | 11.1% |
Similar Demographics by Single Female Poverty
Demographics Similar to Scottish by Single Female Poverty
In terms of single female poverty, the demographic groups most similar to Scottish are Barbadian (21.8%, a difference of 0.020%), Immigrants from Eritrea (21.8%, a difference of 0.14%), Immigrants from Grenada (21.8%, a difference of 0.15%), English (21.9%, a difference of 0.20%), and German (21.8%, a difference of 0.21%).
| Demographics | Rating | Rank | Single Female Poverty |
| Immigrants | Barbados | 12.2 /100 | #216 | Poor 21.7% |
| Immigrants | St. Vincent and the Grenadines | 11.7 /100 | #217 | Poor 21.7% |
| Nepalese | 9.7 /100 | #218 | Tragic 21.7% |
| Panamanians | 9.4 /100 | #219 | Tragic 21.7% |
| Germans | 8.3 /100 | #220 | Tragic 21.8% |
| Immigrants | Grenada | 8.0 /100 | #221 | Tragic 21.8% |
| Immigrants | Eritrea | 7.9 /100 | #222 | Tragic 21.8% |
| Scottish | 7.3 /100 | #223 | Tragic 21.8% |
| Barbadians | 7.2 /100 | #224 | Tragic 21.8% |
| English | 6.4 /100 | #225 | Tragic 21.9% |
| Immigrants | Portugal | 5.8 /100 | #226 | Tragic 21.9% |
| Immigrants | Ghana | 5.8 /100 | #227 | Tragic 21.9% |
| Salvadorans | 5.5 /100 | #228 | Tragic 21.9% |
| Tlingit-Haida | 5.4 /100 | #229 | Tragic 21.9% |
| Immigrants | Western Africa | 5.3 /100 | #230 | Tragic 22.0% |
Demographics Similar to Zimbabweans by Single Female Poverty
In terms of single female poverty, the demographic groups most similar to Zimbabweans are Afghan (19.5%, a difference of 0.020%), Immigrants from Ukraine (19.5%, a difference of 0.030%), Immigrants from Lebanon (19.6%, a difference of 0.20%), Soviet Union (19.6%, a difference of 0.27%), and Italian (19.6%, a difference of 0.31%).
| Demographics | Rating | Rank | Single Female Poverty |
| Immigrants | Australia | 99.3 /100 | #80 | Exceptional 19.4% |
| Immigrants | Scotland | 99.2 /100 | #81 | Exceptional 19.4% |
| Immigrants | Malaysia | 99.2 /100 | #82 | Exceptional 19.4% |
| Taiwanese | 99.2 /100 | #83 | Exceptional 19.4% |
| Immigrants | Sweden | 99.2 /100 | #84 | Exceptional 19.4% |
| Immigrants | Albania | 99.2 /100 | #85 | Exceptional 19.4% |
| Greeks | 99.2 /100 | #86 | Exceptional 19.4% |
| Zimbabweans | 99.0 /100 | #87 | Exceptional 19.5% |
| Afghans | 99.0 /100 | #88 | Exceptional 19.5% |
| Immigrants | Ukraine | 99.0 /100 | #89 | Exceptional 19.5% |
| Immigrants | Lebanon | 98.8 /100 | #90 | Exceptional 19.6% |
| Soviet Union | 98.8 /100 | #91 | Exceptional 19.6% |
| Italians | 98.8 /100 | #92 | Exceptional 19.6% |
| Immigrants | Austria | 98.8 /100 | #93 | Exceptional 19.6% |
| Romanians | 98.6 /100 | #94 | Exceptional 19.6% |