Scottish vs Scotch-Irish Single Female Poverty
COMPARE
Scottish
Scotch-Irish
Single Female Poverty
Single Female Poverty Comparison
Scottish
Scotch-Irish
21.8%
SINGLE FEMALE POVERTY
7.3/ 100
METRIC RATING
223rd/ 347
METRIC RANK
22.9%
SINGLE FEMALE POVERTY
0.3/ 100
METRIC RATING
263rd/ 347
METRIC RANK
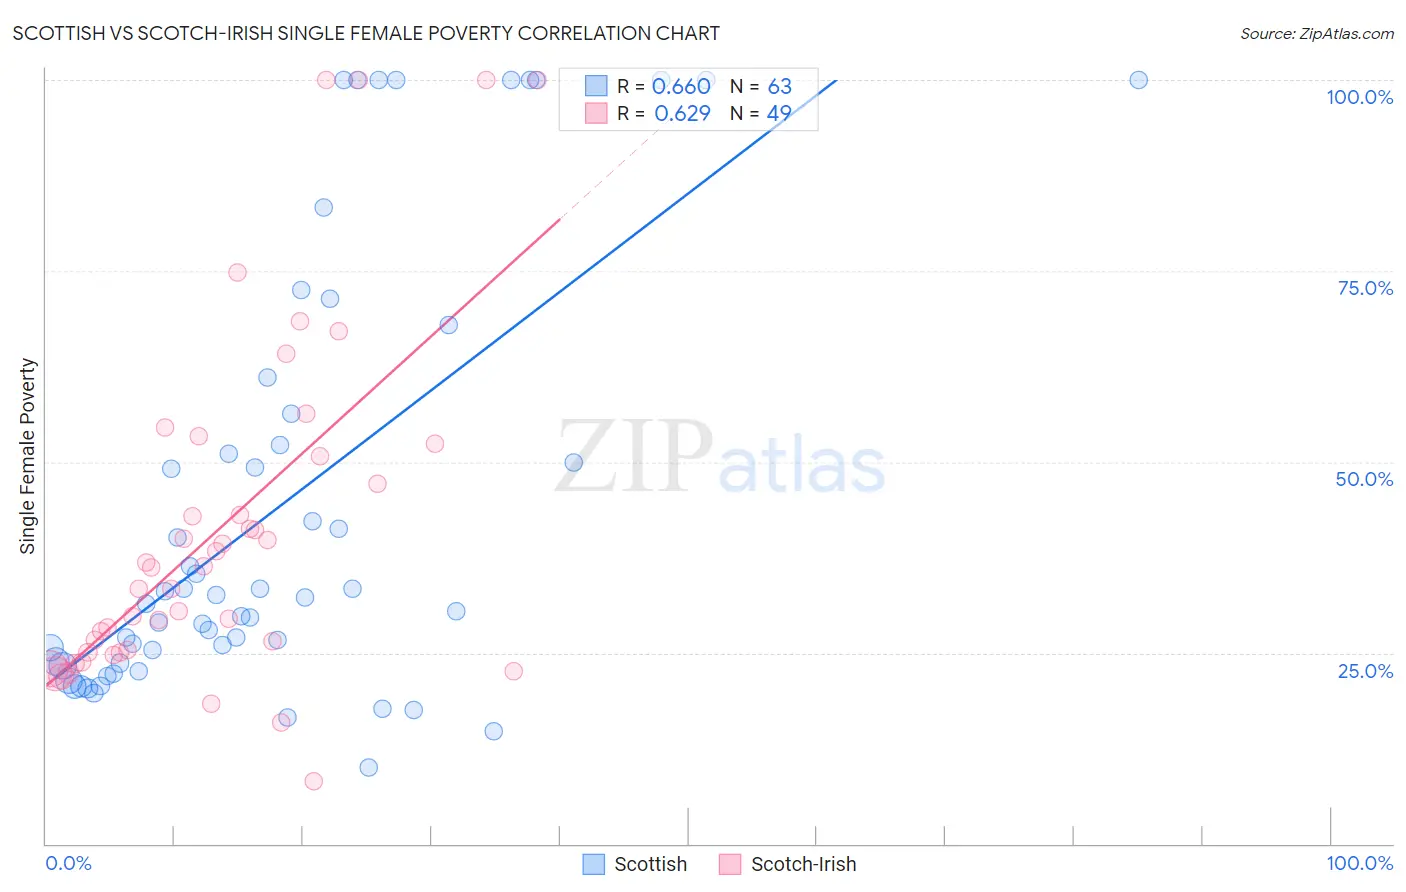
Scottish vs Scotch-Irish Single Female Poverty Correlation Chart
The statistical analysis conducted on geographies consisting of 546,834,351 people shows a significant positive correlation between the proportion of Scottish and poverty level among single females in the United States with a correlation coefficient (R) of 0.660 and weighted average of 21.8%. Similarly, the statistical analysis conducted on geographies consisting of 531,342,644 people shows a significant positive correlation between the proportion of Scotch-Irish and poverty level among single females in the United States with a correlation coefficient (R) of 0.629 and weighted average of 22.9%, a difference of 5.0%.
Single Female Poverty Correlation Summary
| Measurement | Scottish | Scotch-Irish |
| Minimum | 10.0% | 8.1% |
| Maximum | 100.0% | 100.0% |
| Range | 90.0% | 91.9% |
| Mean | 44.2% | 41.2% |
| Median | 32.2% | 36.1% |
| Interquartile 25% (IQ1) | 23.7% | 25.0% |
| Interquartile 75% (IQ3) | 56.2% | 51.6% |
| Interquartile Range (IQR) | 32.6% | 26.6% |
| Standard Deviation (Sample) | 28.5% | 22.8% |
| Standard Deviation (Population) | 28.3% | 22.5% |
Similar Demographics by Single Female Poverty
Demographics Similar to Scottish by Single Female Poverty
In terms of single female poverty, the demographic groups most similar to Scottish are Barbadian (21.8%, a difference of 0.020%), Immigrants from Eritrea (21.8%, a difference of 0.14%), Immigrants from Grenada (21.8%, a difference of 0.15%), English (21.9%, a difference of 0.20%), and German (21.8%, a difference of 0.21%).
| Demographics | Rating | Rank | Single Female Poverty |
| Immigrants | Barbados | 12.2 /100 | #216 | Poor 21.7% |
| Immigrants | St. Vincent and the Grenadines | 11.7 /100 | #217 | Poor 21.7% |
| Nepalese | 9.7 /100 | #218 | Tragic 21.7% |
| Panamanians | 9.4 /100 | #219 | Tragic 21.7% |
| Germans | 8.3 /100 | #220 | Tragic 21.8% |
| Immigrants | Grenada | 8.0 /100 | #221 | Tragic 21.8% |
| Immigrants | Eritrea | 7.9 /100 | #222 | Tragic 21.8% |
| Scottish | 7.3 /100 | #223 | Tragic 21.8% |
| Barbadians | 7.2 /100 | #224 | Tragic 21.8% |
| English | 6.4 /100 | #225 | Tragic 21.9% |
| Immigrants | Portugal | 5.8 /100 | #226 | Tragic 21.9% |
| Immigrants | Ghana | 5.8 /100 | #227 | Tragic 21.9% |
| Salvadorans | 5.5 /100 | #228 | Tragic 21.9% |
| Tlingit-Haida | 5.4 /100 | #229 | Tragic 21.9% |
| Immigrants | Western Africa | 5.3 /100 | #230 | Tragic 22.0% |
Demographics Similar to Scotch-Irish by Single Female Poverty
In terms of single female poverty, the demographic groups most similar to Scotch-Irish are Immigrants from Laos (22.9%, a difference of 0.070%), Central American (23.0%, a difference of 0.24%), British West Indian (22.8%, a difference of 0.41%), Immigrants from Micronesia (23.0%, a difference of 0.45%), and Senegalese (23.0%, a difference of 0.51%).
| Demographics | Rating | Rank | Single Female Poverty |
| Immigrants | Belize | 0.8 /100 | #256 | Tragic 22.6% |
| Sudanese | 0.7 /100 | #257 | Tragic 22.6% |
| Bahamians | 0.6 /100 | #258 | Tragic 22.7% |
| Whites/Caucasians | 0.6 /100 | #259 | Tragic 22.7% |
| Celtics | 0.5 /100 | #260 | Tragic 22.7% |
| Immigrants | Cabo Verde | 0.4 /100 | #261 | Tragic 22.8% |
| British West Indians | 0.4 /100 | #262 | Tragic 22.8% |
| Scotch-Irish | 0.3 /100 | #263 | Tragic 22.9% |
| Immigrants | Laos | 0.3 /100 | #264 | Tragic 22.9% |
| Central Americans | 0.2 /100 | #265 | Tragic 23.0% |
| Immigrants | Micronesia | 0.2 /100 | #266 | Tragic 23.0% |
| Senegalese | 0.2 /100 | #267 | Tragic 23.0% |
| Fijians | 0.2 /100 | #268 | Tragic 23.1% |
| Hmong | 0.2 /100 | #269 | Tragic 23.1% |
| Inupiat | 0.2 /100 | #270 | Tragic 23.1% |