Scottish vs Zimbabwean Cognitive Disability
COMPARE
Scottish
Zimbabwean
Cognitive Disability
Cognitive Disability Comparison
Scottish
Zimbabweans
16.9%
COGNITIVE DISABILITY
95.0/ 100
METRIC RATING
120th/ 347
METRIC RANK
17.6%
COGNITIVE DISABILITY
6.1/ 100
METRIC RATING
220th/ 347
METRIC RANK
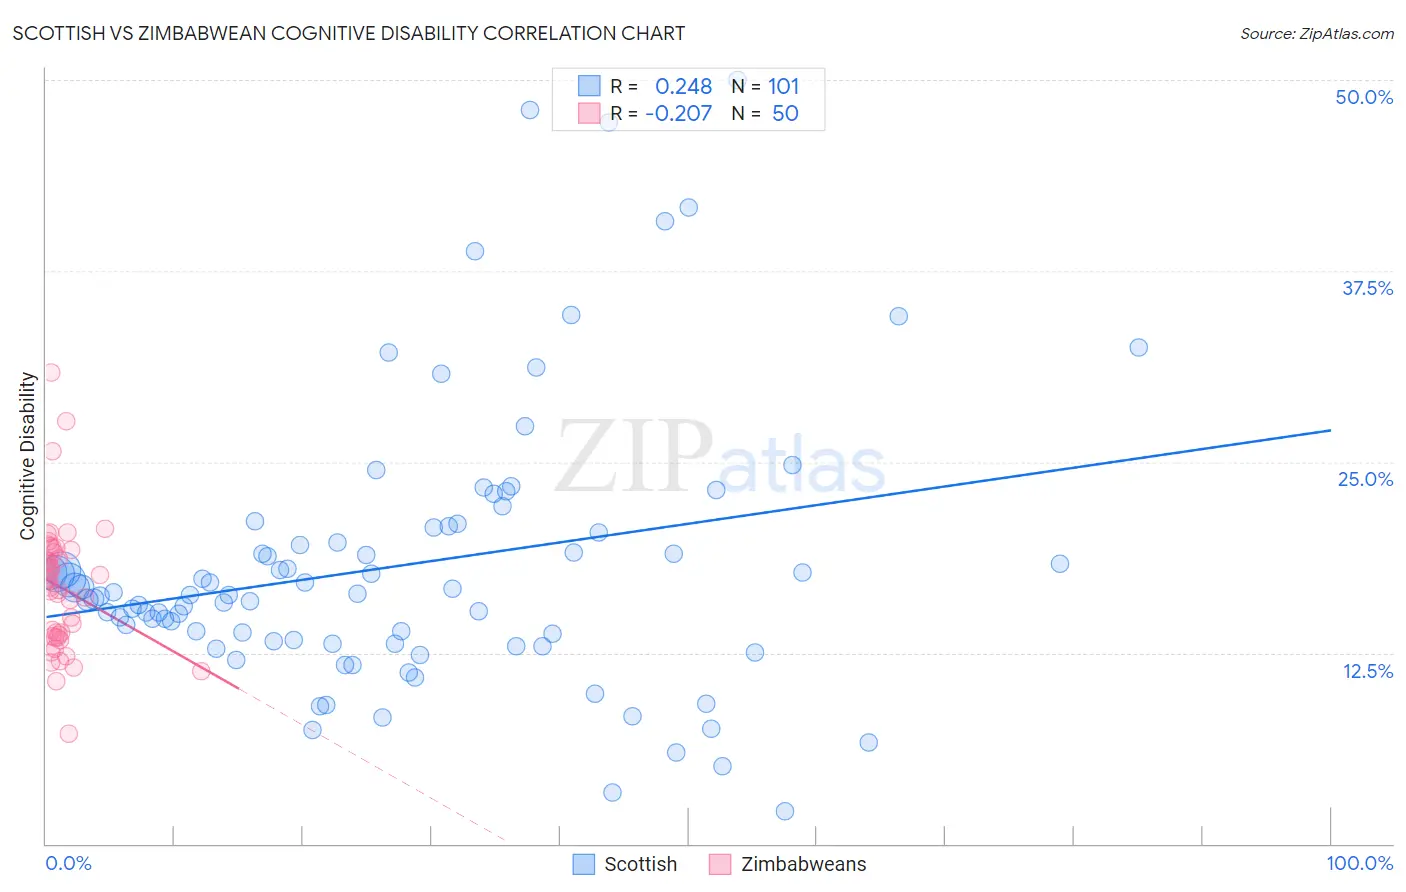
Scottish vs Zimbabwean Cognitive Disability Correlation Chart
The statistical analysis conducted on geographies consisting of 566,987,666 people shows a weak positive correlation between the proportion of Scottish and percentage of population with cognitive disability in the United States with a correlation coefficient (R) of 0.248 and weighted average of 16.9%. Similarly, the statistical analysis conducted on geographies consisting of 69,204,510 people shows a weak negative correlation between the proportion of Zimbabweans and percentage of population with cognitive disability in the United States with a correlation coefficient (R) of -0.207 and weighted average of 17.6%, a difference of 4.1%.
Cognitive Disability Correlation Summary
| Measurement | Scottish | Zimbabwean |
| Minimum | 2.1% | 7.2% |
| Maximum | 50.0% | 30.8% |
| Range | 47.9% | 23.7% |
| Mean | 18.2% | 16.8% |
| Median | 16.3% | 17.1% |
| Interquartile 25% (IQ1) | 13.2% | 13.6% |
| Interquartile 75% (IQ3) | 20.5% | 19.2% |
| Interquartile Range (IQR) | 7.3% | 5.6% |
| Standard Deviation (Sample) | 9.1% | 4.3% |
| Standard Deviation (Population) | 9.0% | 4.2% |
Similar Demographics by Cognitive Disability
Demographics Similar to Scottish by Cognitive Disability
In terms of cognitive disability, the demographic groups most similar to Scottish are Immigrants from China (16.9%, a difference of 0.020%), Immigrants from Western Europe (16.9%, a difference of 0.030%), Portuguese (16.9%, a difference of 0.040%), Turkish (16.9%, a difference of 0.070%), and South African (16.9%, a difference of 0.080%).
| Demographics | Rating | Rank | Cognitive Disability |
| Immigrants | Sri Lanka | 97.1 /100 | #113 | Exceptional 16.8% |
| Koreans | 97.1 /100 | #114 | Exceptional 16.8% |
| Yup'ik | 96.9 /100 | #115 | Exceptional 16.9% |
| Inupiat | 96.5 /100 | #116 | Exceptional 16.9% |
| Immigrants | Japan | 96.2 /100 | #117 | Exceptional 16.9% |
| Immigrants | Denmark | 96.2 /100 | #118 | Exceptional 16.9% |
| South Africans | 95.5 /100 | #119 | Exceptional 16.9% |
| Scottish | 95.0 /100 | #120 | Exceptional 16.9% |
| Immigrants | China | 94.9 /100 | #121 | Exceptional 16.9% |
| Immigrants | Western Europe | 94.8 /100 | #122 | Exceptional 16.9% |
| Portuguese | 94.7 /100 | #123 | Exceptional 16.9% |
| Turks | 94.5 /100 | #124 | Exceptional 16.9% |
| Scandinavians | 94.1 /100 | #125 | Exceptional 16.9% |
| Europeans | 93.4 /100 | #126 | Exceptional 17.0% |
| Immigrants | Costa Rica | 93.1 /100 | #127 | Exceptional 17.0% |
Demographics Similar to Zimbabweans by Cognitive Disability
In terms of cognitive disability, the demographic groups most similar to Zimbabweans are Moroccan (17.6%, a difference of 0.020%), Immigrants from Sierra Leone (17.6%, a difference of 0.030%), Icelander (17.6%, a difference of 0.040%), Salvadoran (17.6%, a difference of 0.070%), and Okinawan (17.6%, a difference of 0.090%).
| Demographics | Rating | Rank | Cognitive Disability |
| Hawaiians | 7.2 /100 | #213 | Tragic 17.6% |
| Immigrants | El Salvador | 7.0 /100 | #214 | Tragic 17.6% |
| Alaskan Athabascans | 6.9 /100 | #215 | Tragic 17.6% |
| Okinawans | 6.8 /100 | #216 | Tragic 17.6% |
| Salvadorans | 6.7 /100 | #217 | Tragic 17.6% |
| Icelanders | 6.4 /100 | #218 | Tragic 17.6% |
| Immigrants | Sierra Leone | 6.3 /100 | #219 | Tragic 17.6% |
| Zimbabweans | 6.1 /100 | #220 | Tragic 17.6% |
| Moroccans | 5.9 /100 | #221 | Tragic 17.6% |
| Central Americans | 4.5 /100 | #222 | Tragic 17.7% |
| Alsatians | 4.5 /100 | #223 | Tragic 17.7% |
| Fijians | 3.4 /100 | #224 | Tragic 17.7% |
| Vietnamese | 3.4 /100 | #225 | Tragic 17.7% |
| Marshallese | 2.7 /100 | #226 | Tragic 17.7% |
| Immigrants | St. Vincent and the Grenadines | 2.6 /100 | #227 | Tragic 17.7% |