Scottish vs Immigrants from Fiji Single Female Poverty
COMPARE
Scottish
Immigrants from Fiji
Single Female Poverty
Single Female Poverty Comparison
Scottish
Immigrants from Fiji
21.8%
SINGLE FEMALE POVERTY
7.3/ 100
METRIC RATING
223rd/ 347
METRIC RANK
19.1%
SINGLE FEMALE POVERTY
99.7/ 100
METRIC RATING
56th/ 347
METRIC RANK
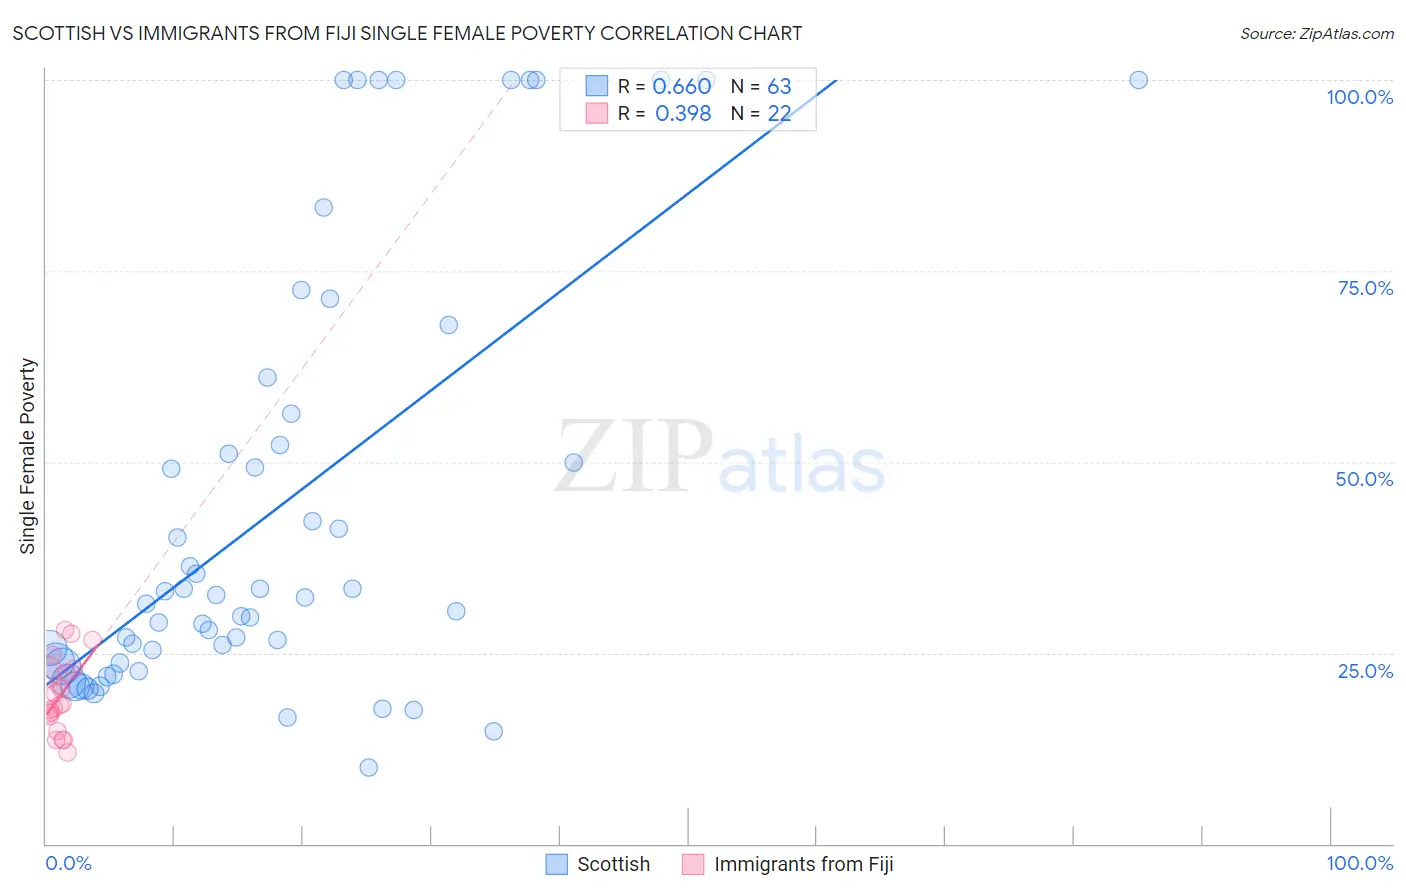
Scottish vs Immigrants from Fiji Single Female Poverty Correlation Chart
The statistical analysis conducted on geographies consisting of 546,834,351 people shows a significant positive correlation between the proportion of Scottish and poverty level among single females in the United States with a correlation coefficient (R) of 0.660 and weighted average of 21.8%. Similarly, the statistical analysis conducted on geographies consisting of 93,459,026 people shows a mild positive correlation between the proportion of Immigrants from Fiji and poverty level among single females in the United States with a correlation coefficient (R) of 0.398 and weighted average of 19.1%, a difference of 14.2%.
Single Female Poverty Correlation Summary
| Measurement | Scottish | Immigrants from Fiji |
| Minimum | 10.0% | 11.9% |
| Maximum | 100.0% | 28.1% |
| Range | 90.0% | 16.1% |
| Mean | 44.2% | 19.3% |
| Median | 32.2% | 18.3% |
| Interquartile 25% (IQ1) | 23.7% | 16.7% |
| Interquartile 75% (IQ3) | 56.2% | 22.6% |
| Interquartile Range (IQR) | 32.6% | 5.9% |
| Standard Deviation (Sample) | 28.5% | 4.7% |
| Standard Deviation (Population) | 28.3% | 4.6% |
Similar Demographics by Single Female Poverty
Demographics Similar to Scottish by Single Female Poverty
In terms of single female poverty, the demographic groups most similar to Scottish are Barbadian (21.8%, a difference of 0.020%), Immigrants from Eritrea (21.8%, a difference of 0.14%), Immigrants from Grenada (21.8%, a difference of 0.15%), English (21.9%, a difference of 0.20%), and German (21.8%, a difference of 0.21%).
| Demographics | Rating | Rank | Single Female Poverty |
| Immigrants | Barbados | 12.2 /100 | #216 | Poor 21.7% |
| Immigrants | St. Vincent and the Grenadines | 11.7 /100 | #217 | Poor 21.7% |
| Nepalese | 9.7 /100 | #218 | Tragic 21.7% |
| Panamanians | 9.4 /100 | #219 | Tragic 21.7% |
| Germans | 8.3 /100 | #220 | Tragic 21.8% |
| Immigrants | Grenada | 8.0 /100 | #221 | Tragic 21.8% |
| Immigrants | Eritrea | 7.9 /100 | #222 | Tragic 21.8% |
| Scottish | 7.3 /100 | #223 | Tragic 21.8% |
| Barbadians | 7.2 /100 | #224 | Tragic 21.8% |
| English | 6.4 /100 | #225 | Tragic 21.9% |
| Immigrants | Portugal | 5.8 /100 | #226 | Tragic 21.9% |
| Immigrants | Ghana | 5.8 /100 | #227 | Tragic 21.9% |
| Salvadorans | 5.5 /100 | #228 | Tragic 21.9% |
| Tlingit-Haida | 5.4 /100 | #229 | Tragic 21.9% |
| Immigrants | Western Africa | 5.3 /100 | #230 | Tragic 22.0% |
Demographics Similar to Immigrants from Fiji by Single Female Poverty
In terms of single female poverty, the demographic groups most similar to Immigrants from Fiji are Immigrants from Vietnam (19.1%, a difference of 0.050%), Eastern European (19.1%, a difference of 0.060%), Argentinean (19.1%, a difference of 0.090%), Tsimshian (19.1%, a difference of 0.10%), and Immigrants from Bulgaria (19.1%, a difference of 0.18%).
| Demographics | Rating | Rank | Single Female Poverty |
| Immigrants | Czechoslovakia | 99.8 /100 | #49 | Exceptional 19.0% |
| Immigrants | Eastern Europe | 99.8 /100 | #50 | Exceptional 19.0% |
| Immigrants | Italy | 99.8 /100 | #51 | Exceptional 19.0% |
| Egyptians | 99.7 /100 | #52 | Exceptional 19.1% |
| Tsimshian | 99.7 /100 | #53 | Exceptional 19.1% |
| Argentineans | 99.7 /100 | #54 | Exceptional 19.1% |
| Immigrants | Vietnam | 99.7 /100 | #55 | Exceptional 19.1% |
| Immigrants | Fiji | 99.7 /100 | #56 | Exceptional 19.1% |
| Eastern Europeans | 99.7 /100 | #57 | Exceptional 19.1% |
| Immigrants | Bulgaria | 99.7 /100 | #58 | Exceptional 19.1% |
| Sri Lankans | 99.6 /100 | #59 | Exceptional 19.2% |
| Russians | 99.6 /100 | #60 | Exceptional 19.2% |
| Cambodians | 99.6 /100 | #61 | Exceptional 19.2% |
| Lithuanians | 99.6 /100 | #62 | Exceptional 19.2% |
| Immigrants | Northern Europe | 99.6 /100 | #63 | Exceptional 19.2% |