Immigrants from Southern Europe vs Zimbabwean Single Female Poverty

COMPARE

Immigrants from Southern Europe
Race
Ancestry
AfghanAfricanAlaska NativeAlaskan AthabascanAlbanianAleutAlsatianAmericanApacheArabArapahoArgentineanArmenianAssyrian/Chaldean/SyriacAustralianAustrianBahamianBangladeshiBarbadianBasqueBelgianBelizeanBermudanBhutaneseBlackfeetBolivianBrazilianBritishBritish West IndianBulgarianBurmeseCajunCambodianCanadianCape VerdeanCarpatho RusynCelticCentral AmericanCentral American IndianCherokeeCheyenneChickasawChileanChineseChippewaChoctawColombianColvilleComancheCosta RicanCreeCreekCroatianCrowCubanCypriotCzechCzechoslovakianDanishDelawareDominicanDutchDutch West IndianEastern EuropeanEcuadorianEgyptianEnglishEstonianEthiopianEuropeanFijianFilipinoFinnishFrenchFrench American IndianFrench CanadianGermanGerman RussianGhanaianGreekGuamanian/ChamorroGuatemalanGuyaneseHaitianHmongHonduranHopiHoumaHungarianIcelanderIndian (Asian)IndonesianInupiatIranianIraqiIrishIroquoisIsraeliItalianJamaicanJapaneseJordanianKenyanKiowaKoreanLaotianLatvianLebaneseLiberianLithuanianLumbeeLuxembourgerMacedonianMalaysianMalteseMarshalleseMenomineeMexicanMexican American IndianMongolianMoroccanNative HawaiianNavajoNepaleseNew ZealanderNicaraguanNigerianNorthern EuropeanNorwegianOkinawanOsageOttawaPaiutePakistaniPalestinianPanamanianParaguayanPennsylvania GermanPeruvianPimaPolishPortuguesePotawatomiPuebloPuerto RicanPuget Sound SalishRomanianRussianSalvadoranSamoanScandinavianScotch-IrishScottishSeminoleSenegaleseSerbianShoshoneSierra LeoneanSiouxSlavicSlovakSloveneSomaliSouth AfricanSouth AmericanSouth American IndianSoviet UnionSpaniardSpanishSpanish AmericanSpanish American IndianSri LankanSubsaharan AfricanSudaneseSwedishSwissSyrianTaiwaneseThaiTlingit-HaidaTohono O'OdhamTonganTrinidadian and TobagonianTsimshianTurkishU.S. Virgin IslanderUgandanUkrainianUruguayanUteVenezuelanVietnameseWelshWest IndianYakamaYaquiYugoslavianYumanYup'ik
Immigration
NonimmigrantsImmigrantsAfghanistanAfricaAlbaniaArgentinaArmeniaAsiaAustraliaAustriaBahamasBangladeshBarbadosBelarusBelgiumBelizeBoliviaBosnia and HerzegovinaBrazilBulgariaBurma/MyanmarCabo VerdeCambodiaCameroonCanadaCaribbeanCentral AmericaChileChinaColombiaCongoCosta RicaCroatiaCubaCzechoslovakiaDenmarkDominicaDominican RepublicEastern AfricaEastern AsiaEastern EuropeEcuadorEgyptEl SalvadorEnglandEritreaEthiopiaEuropeFijiFranceGermanyGhanaGreeceGrenadaGuatemalaGuyanaHaitiHondurasHong KongHungaryIndiaIndonesiaIranIraqIrelandIsraelItalyJamaicaJapanJordanKazakhstanKenyaKoreaKuwaitLaosLatin AmericaLatviaLebanonLiberiaLithuaniaMalaysiaMexicoMicronesiaMiddle AfricaMoldovaMoroccoNepalNetherlandsNicaraguaNigeriaNorth AmericaNorth MacedoniaNorthern AfricaNorthern EuropeNorwayOceaniaPakistanPanamaPeruPhilippinesPolandPortugalRomaniaRussiaSaudi ArabiaScotlandSenegalSerbiaSierra LeoneSingaporeSomaliaSouth AfricaSouth AmericaSouth Central AsiaSouth Eastern AsiaSouthern EuropeSpainSri LankaSt. Vincent and the GrenadinesSudanSwedenSwitzerlandSyriaTaiwanThailandTrinidad and TobagoTurkeyUgandaUkraineUruguayUzbekistanVenezuelaVietnamWest IndiesWestern AfricaWestern AsiaWestern EuropeYemenZaireZimbabweAzores
Zimbabwean
Race
Ancestry
AfghanAfricanAlaska NativeAlaskan AthabascanAlbanianAleutAlsatianAmericanApacheArabArapahoArgentineanArmenianAssyrian/Chaldean/SyriacAustralianAustrianBahamianBangladeshiBarbadianBasqueBelgianBelizeanBermudanBhutaneseBlackfeetBolivianBrazilianBritishBritish West IndianBulgarianBurmeseCajunCambodianCanadianCape VerdeanCarpatho RusynCelticCentral AmericanCentral American IndianCherokeeCheyenneChickasawChileanChineseChippewaChoctawColombianColvilleComancheCosta RicanCreeCreekCroatianCrowCubanCypriotCzechCzechoslovakianDanishDelawareDominicanDutchDutch West IndianEastern EuropeanEcuadorianEgyptianEnglishEstonianEthiopianEuropeanFijianFilipinoFinnishFrenchFrench American IndianFrench CanadianGermanGerman RussianGhanaianGreekGuamanian/ChamorroGuatemalanGuyaneseHaitianHmongHonduranHopiHoumaHungarianIcelanderIndian (Asian)IndonesianInupiatIranianIraqiIrishIroquoisIsraeliItalianJamaicanJapaneseJordanianKenyanKiowaKoreanLaotianLatvianLebaneseLiberianLithuanianLumbeeLuxembourgerMacedonianMalaysianMalteseMarshalleseMenomineeMexicanMexican American IndianMongolianMoroccanNative HawaiianNavajoNepaleseNew ZealanderNicaraguanNigerianNorthern EuropeanNorwegianOkinawanOsageOttawaPaiutePakistaniPalestinianPanamanianParaguayanPennsylvania GermanPeruvianPimaPolishPortuguesePotawatomiPuebloPuerto RicanPuget Sound SalishRomanianRussianSalvadoranSamoanScandinavianScotch-IrishScottishSeminoleSenegaleseSerbianShoshoneSierra LeoneanSiouxSlavicSlovakSloveneSomaliSouth AfricanSouth AmericanSouth American IndianSoviet UnionSpaniardSpanishSpanish AmericanSpanish American IndianSri LankanSubsaharan AfricanSudaneseSwedishSwissSyrianTaiwaneseThaiTlingit-HaidaTohono O'OdhamTonganTrinidadian and TobagonianTsimshianTurkishU.S. Virgin IslanderUgandanUkrainianUruguayanUteVenezuelanVietnameseWelshWest IndianYakamaYaquiYugoslavianYumanYup'ikZimbabwean
Immigration
NonimmigrantsImmigrantsAfghanistanAfricaAlbaniaArgentinaArmeniaAsiaAustraliaAustriaBahamasBangladeshBarbadosBelarusBelgiumBelizeBoliviaBosnia and HerzegovinaBrazilBulgariaBurma/MyanmarCabo VerdeCambodiaCameroonCanadaCaribbeanCentral AmericaChileChinaColombiaCongoCosta RicaCroatiaCubaCzechoslovakiaDenmarkDominicaDominican RepublicEastern AfricaEastern AsiaEastern EuropeEcuadorEgyptEl SalvadorEnglandEritreaEthiopiaEuropeFijiFranceGermanyGhanaGreeceGrenadaGuatemalaGuyanaHaitiHondurasHong KongHungaryIndiaIndonesiaIranIraqIrelandIsraelItalyJamaicaJapanJordanKazakhstanKenyaKoreaKuwaitLaosLatin AmericaLatviaLebanonLiberiaLithuaniaMalaysiaMexicoMicronesiaMiddle AfricaMoldovaMoroccoNepalNetherlandsNicaraguaNigeriaNorth AmericaNorth MacedoniaNorthern AfricaNorthern EuropeNorwayOceaniaPakistanPanamaPeruPhilippinesPolandPortugalRomaniaRussiaSaudi ArabiaScotlandSenegalSerbiaSierra LeoneSingaporeSomaliaSouth AfricaSouth AmericaSouth Central AsiaSouth Eastern AsiaSpainSri LankaSt. Vincent and the GrenadinesSudanSwedenSwitzerlandSyriaTaiwanThailandTrinidad and TobagoTurkeyUgandaUkraineUruguayUzbekistanVenezuelaVietnamWest IndiesWestern AfricaWestern AsiaWestern EuropeYemenZaireZimbabweAzores
Single Female Poverty
Income
Poverty
Unemployment
Labor Participation
Family Structure
Vehicle Availability
Education Level
Disability

Single Female Poverty Comparison

Immigrants from Southern Europe

Zimbabweans

Exceptional
Exceptional
19.9%
SINGLE FEMALE POVERTY
97.1/ 100
METRIC RATING
103rd/ 347
METRIC RANK
19.5%
SINGLE FEMALE POVERTY
99.0/ 100
METRIC RATING
87th/ 347
METRIC RANK

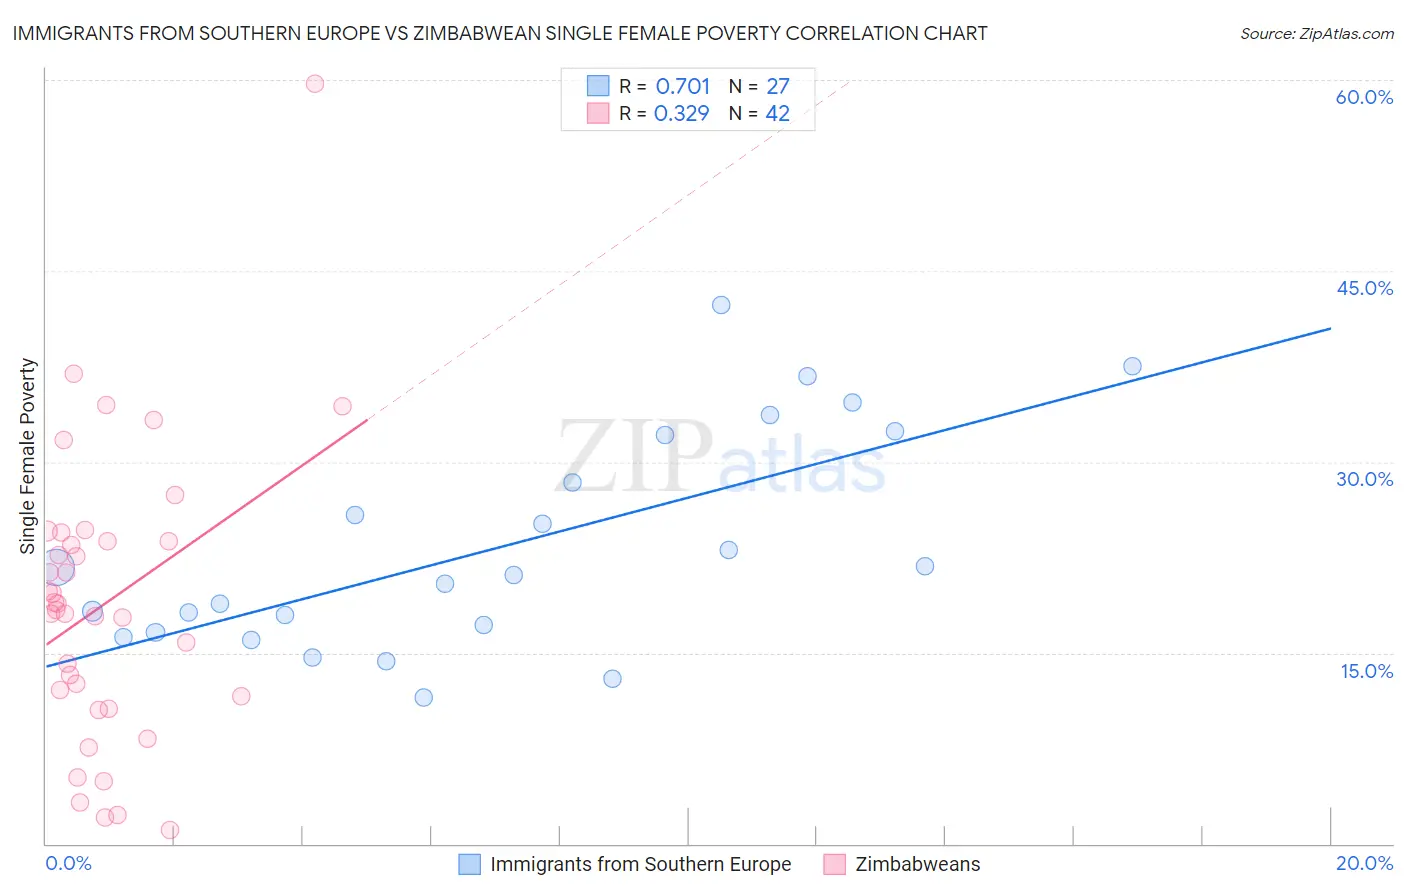
Immigrants from Southern Europe vs Zimbabwean Single Female Poverty Correlation Chart

The statistical analysis conducted on geographies consisting of 394,858,159 people shows a strong positive correlation between the proportion of Immigrants from Southern Europe and poverty level among single females in the United States with a correlation coefficient (R) of 0.701 and weighted average of 19.9%. Similarly, the statistical analysis conducted on geographies consisting of 69,078,290 people shows a mild positive correlation between the proportion of Zimbabweans and poverty level among single females in the United States with a correlation coefficient (R) of 0.329 and weighted average of 19.5%, a difference of 1.8%.
Immigrants from Southern Europe vs Zimbabwean Single Female Poverty

Single Female Poverty Correlation Summary

MeasurementImmigrants from Southern EuropeZimbabwean
Minimum11.5%1.1%
Maximum42.3%59.7%
Range30.8%58.6%
Mean23.3%18.9%
Median21.1%18.6%
Interquartile 25% (IQ1)16.6%11.6%
Interquartile 75% (IQ3)32.1%23.8%
Interquartile Range (IQR)15.5%12.2%
Standard Deviation (Sample)8.5%11.3%
Standard Deviation (Population)8.3%11.1%

Demographics Similar to Immigrants from Southern Europe and Zimbabweans by Single Female Poverty

In terms of single female poverty, the demographic groups most similar to Immigrants from Southern Europe are Immigrants from Cameroon (19.8%, a difference of 0.12%), Chilean (19.9%, a difference of 0.12%), Immigrants from Belgium (19.8%, a difference of 0.13%), Israeli (19.9%, a difference of 0.13%), and Ukrainian (19.8%, a difference of 0.31%). Similarly, the demographic groups most similar to Zimbabweans are Afghan (19.5%, a difference of 0.020%), Immigrants from Ukraine (19.5%, a difference of 0.030%), Immigrants from Lebanon (19.6%, a difference of 0.20%), Soviet Union (19.6%, a difference of 0.27%), and Italian (19.6%, a difference of 0.31%).
DemographicsRating | RankSingle Female Poverty
Immigrants | Albania
99.2
/100
|
#85
Exceptional
19.4%
Greeks
99.2
/100
|
#86
Exceptional
19.4%
Zimbabweans
99.0
/100
|
#87
Exceptional
19.5%
Afghans
99.0
/100
|
#88
Exceptional
19.5%
Immigrants | Ukraine
99.0
/100
|
#89
Exceptional
19.5%
Immigrants | Lebanon
98.8
/100
|
#90
Exceptional
19.6%
Soviet Union
98.8
/100
|
#91
Exceptional
19.6%
Italians
98.8
/100
|
#92
Exceptional
19.6%
Immigrants | Austria
98.8
/100
|
#93
Exceptional
19.6%
Romanians
98.6
/100
|
#94
Exceptional
19.6%
Estonians
98.2
/100
|
#95
Exceptional
19.7%
Immigrants | Brazil
98.2
/100
|
#96
Exceptional
19.7%
Croatians
98.1
/100
|
#97
Exceptional
19.7%
Immigrants | France
97.9
/100
|
#98
Exceptional
19.7%
Sierra Leoneans
97.9
/100
|
#99
Exceptional
19.7%
Ukrainians
97.6
/100
|
#100
Exceptional
19.8%
Immigrants | Belgium
97.3
/100
|
#101
Exceptional
19.8%
Immigrants | Cameroon
97.3
/100
|
#102
Exceptional
19.8%
Immigrants | Southern Europe
97.1
/100
|
#103
Exceptional
19.9%
Chileans
96.9
/100
|
#104
Exceptional
19.9%
Israelis
96.9
/100
|
#105
Exceptional
19.9%