Scottish vs Northern European Single Female Poverty
COMPARE
Scottish
Northern European
Single Female Poverty
Single Female Poverty Comparison
Scottish
Northern Europeans
21.8%
SINGLE FEMALE POVERTY
7.3/ 100
METRIC RATING
223rd/ 347
METRIC RANK
20.8%
SINGLE FEMALE POVERTY
68.4/ 100
METRIC RATING
162nd/ 347
METRIC RANK
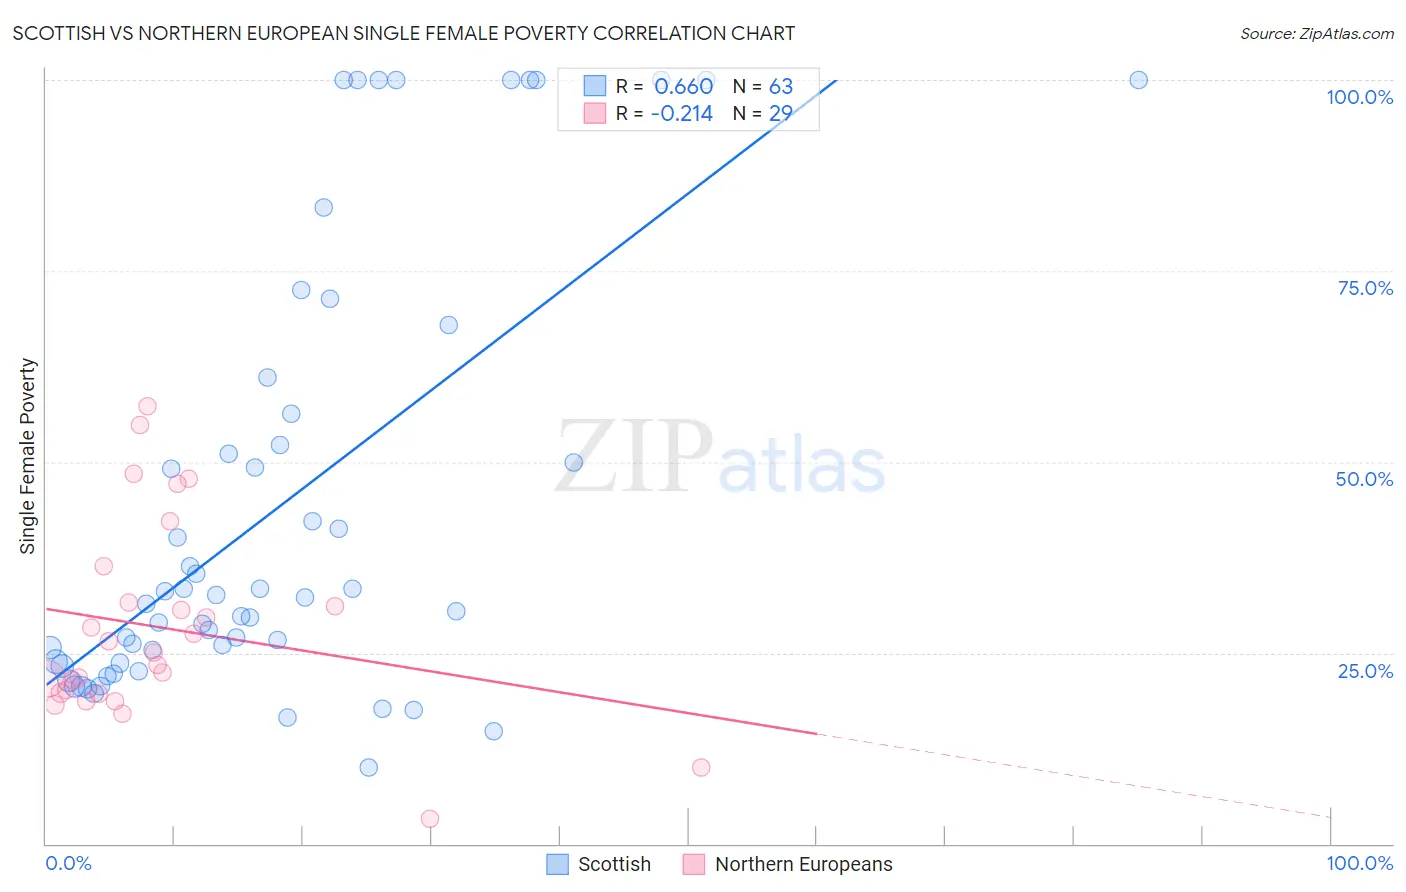
Scottish vs Northern European Single Female Poverty Correlation Chart
The statistical analysis conducted on geographies consisting of 546,834,351 people shows a significant positive correlation between the proportion of Scottish and poverty level among single females in the United States with a correlation coefficient (R) of 0.660 and weighted average of 21.8%. Similarly, the statistical analysis conducted on geographies consisting of 398,261,787 people shows a weak negative correlation between the proportion of Northern Europeans and poverty level among single females in the United States with a correlation coefficient (R) of -0.214 and weighted average of 20.8%, a difference of 5.2%.
Single Female Poverty Correlation Summary
| Measurement | Scottish | Northern European |
| Minimum | 10.0% | 3.3% |
| Maximum | 100.0% | 57.3% |
| Range | 90.0% | 54.0% |
| Mean | 44.2% | 28.3% |
| Median | 32.2% | 25.0% |
| Interquartile 25% (IQ1) | 23.7% | 19.7% |
| Interquartile 75% (IQ3) | 56.2% | 34.0% |
| Interquartile Range (IQR) | 32.6% | 14.3% |
| Standard Deviation (Sample) | 28.5% | 13.0% |
| Standard Deviation (Population) | 28.3% | 12.8% |
Similar Demographics by Single Female Poverty
Demographics Similar to Scottish by Single Female Poverty
In terms of single female poverty, the demographic groups most similar to Scottish are Barbadian (21.8%, a difference of 0.020%), Immigrants from Eritrea (21.8%, a difference of 0.14%), Immigrants from Grenada (21.8%, a difference of 0.15%), English (21.9%, a difference of 0.20%), and German (21.8%, a difference of 0.21%).
| Demographics | Rating | Rank | Single Female Poverty |
| Immigrants | Barbados | 12.2 /100 | #216 | Poor 21.7% |
| Immigrants | St. Vincent and the Grenadines | 11.7 /100 | #217 | Poor 21.7% |
| Nepalese | 9.7 /100 | #218 | Tragic 21.7% |
| Panamanians | 9.4 /100 | #219 | Tragic 21.7% |
| Germans | 8.3 /100 | #220 | Tragic 21.8% |
| Immigrants | Grenada | 8.0 /100 | #221 | Tragic 21.8% |
| Immigrants | Eritrea | 7.9 /100 | #222 | Tragic 21.8% |
| Scottish | 7.3 /100 | #223 | Tragic 21.8% |
| Barbadians | 7.2 /100 | #224 | Tragic 21.8% |
| English | 6.4 /100 | #225 | Tragic 21.9% |
| Immigrants | Portugal | 5.8 /100 | #226 | Tragic 21.9% |
| Immigrants | Ghana | 5.8 /100 | #227 | Tragic 21.9% |
| Salvadorans | 5.5 /100 | #228 | Tragic 21.9% |
| Tlingit-Haida | 5.4 /100 | #229 | Tragic 21.9% |
| Immigrants | Western Africa | 5.3 /100 | #230 | Tragic 22.0% |
Demographics Similar to Northern Europeans by Single Female Poverty
In terms of single female poverty, the demographic groups most similar to Northern Europeans are Kenyan (20.8%, a difference of 0.010%), Lebanese (20.8%, a difference of 0.050%), Arab (20.7%, a difference of 0.18%), Costa Rican (20.7%, a difference of 0.26%), and Iraqi (20.8%, a difference of 0.27%).
| Demographics | Rating | Rank | Single Female Poverty |
| Samoans | 76.0 /100 | #155 | Good 20.6% |
| South American Indians | 75.7 /100 | #156 | Good 20.6% |
| Immigrants | Oceania | 74.3 /100 | #157 | Good 20.7% |
| Danes | 73.0 /100 | #158 | Good 20.7% |
| Costa Ricans | 71.8 /100 | #159 | Good 20.7% |
| Arabs | 70.8 /100 | #160 | Good 20.7% |
| Kenyans | 68.5 /100 | #161 | Good 20.8% |
| Northern Europeans | 68.4 /100 | #162 | Good 20.8% |
| Lebanese | 67.6 /100 | #163 | Good 20.8% |
| Iraqis | 64.5 /100 | #164 | Good 20.8% |
| Ugandans | 64.0 /100 | #165 | Good 20.8% |
| Norwegians | 63.0 /100 | #166 | Good 20.8% |
| Immigrants | Norway | 63.0 /100 | #167 | Good 20.8% |
| Immigrants | Costa Rica | 61.5 /100 | #168 | Good 20.9% |
| Immigrants | Trinidad and Tobago | 56.3 /100 | #169 | Average 20.9% |