Immigrants from Latvia vs Zimbabwean Single Female Poverty
COMPARE
Immigrants from Latvia
Zimbabwean
Single Female Poverty
Single Female Poverty Comparison
Immigrants from Latvia
Zimbabweans
19.3%
SINGLE FEMALE POVERTY
99.4/ 100
METRIC RATING
72nd/ 347
METRIC RANK
19.5%
SINGLE FEMALE POVERTY
99.0/ 100
METRIC RATING
87th/ 347
METRIC RANK
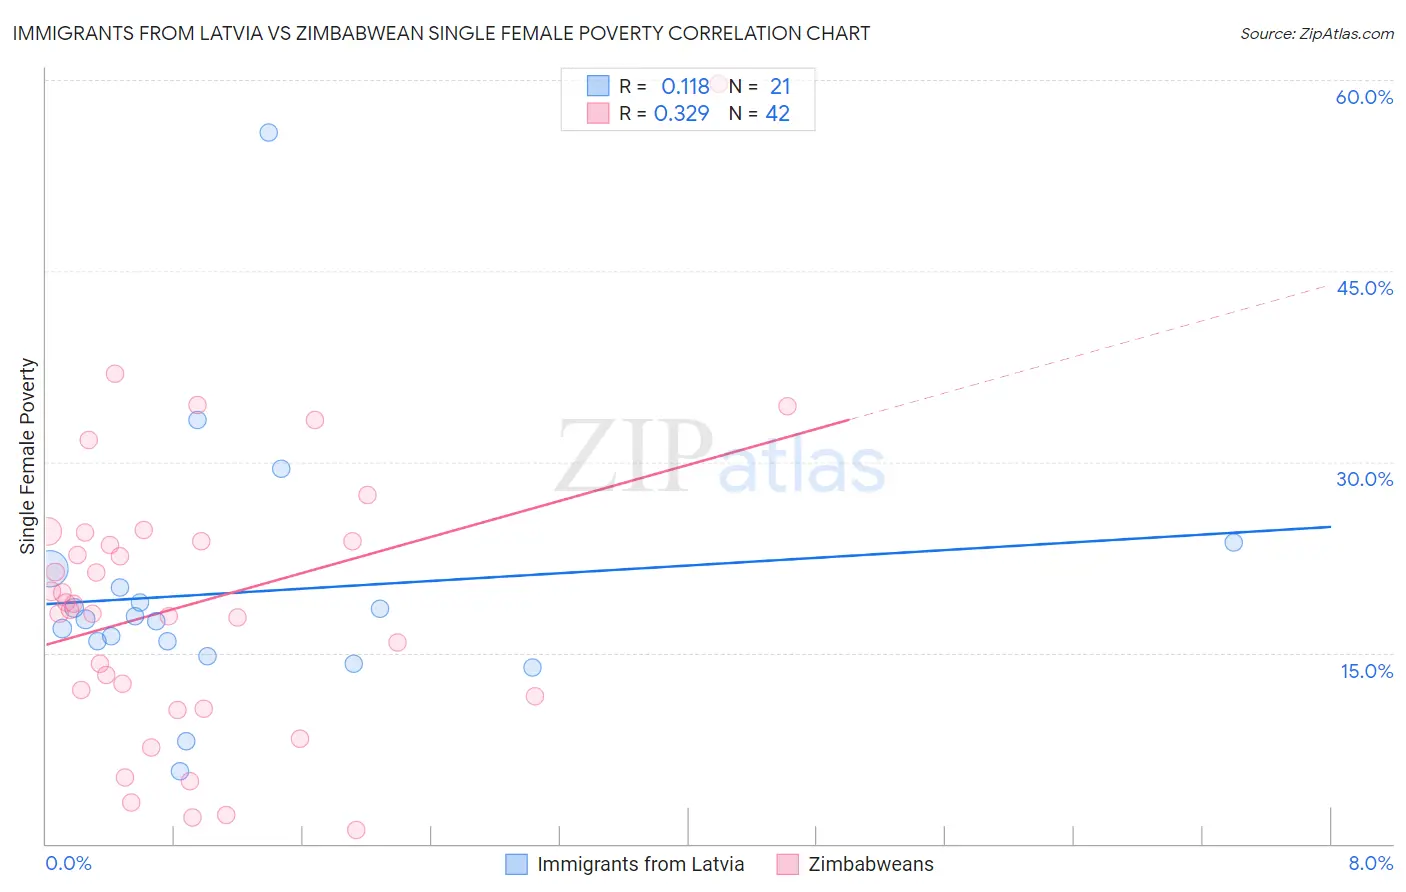
Immigrants from Latvia vs Zimbabwean Single Female Poverty Correlation Chart
The statistical analysis conducted on geographies consisting of 112,952,917 people shows a poor positive correlation between the proportion of Immigrants from Latvia and poverty level among single females in the United States with a correlation coefficient (R) of 0.118 and weighted average of 19.3%. Similarly, the statistical analysis conducted on geographies consisting of 69,078,290 people shows a mild positive correlation between the proportion of Zimbabweans and poverty level among single females in the United States with a correlation coefficient (R) of 0.329 and weighted average of 19.5%, a difference of 0.98%.
Single Female Poverty Correlation Summary
| Measurement | Immigrants from Latvia | Zimbabwean |
| Minimum | 5.7% | 1.1% |
| Maximum | 55.9% | 59.7% |
| Range | 50.1% | 58.6% |
| Mean | 19.7% | 18.9% |
| Median | 17.6% | 18.6% |
| Interquartile 25% (IQ1) | 15.3% | 11.6% |
| Interquartile 75% (IQ3) | 20.9% | 23.8% |
| Interquartile Range (IQR) | 5.6% | 12.2% |
| Standard Deviation (Sample) | 10.2% | 11.3% |
| Standard Deviation (Population) | 10.0% | 11.1% |
Demographics Similar to Immigrants from Latvia and Zimbabweans by Single Female Poverty
In terms of single female poverty, the demographic groups most similar to Immigrants from Latvia are Immigrants from South Eastern Asia (19.3%, a difference of 0.0%), Immigrants from Jordan (19.3%, a difference of 0.070%), Immigrants from Peru (19.3%, a difference of 0.10%), Immigrants from Belarus (19.3%, a difference of 0.11%), and Paraguayan (19.3%, a difference of 0.14%). Similarly, the demographic groups most similar to Zimbabweans are Afghan (19.5%, a difference of 0.020%), Immigrants from Ukraine (19.5%, a difference of 0.030%), Immigrants from Albania (19.4%, a difference of 0.37%), Greek (19.4%, a difference of 0.37%), and Immigrants from Sweden (19.4%, a difference of 0.41%).
| Demographics | Rating | Rank | Single Female Poverty |
| Paraguayans | 99.5 /100 | #69 | Exceptional 19.3% |
| Immigrants | Jordan | 99.4 /100 | #70 | Exceptional 19.3% |
| Immigrants | South Eastern Asia | 99.4 /100 | #71 | Exceptional 19.3% |
| Immigrants | Latvia | 99.4 /100 | #72 | Exceptional 19.3% |
| Immigrants | Peru | 99.4 /100 | #73 | Exceptional 19.3% |
| Immigrants | Belarus | 99.4 /100 | #74 | Exceptional 19.3% |
| Immigrants | Turkey | 99.4 /100 | #75 | Exceptional 19.4% |
| Peruvians | 99.4 /100 | #76 | Exceptional 19.4% |
| Immigrants | Russia | 99.3 /100 | #77 | Exceptional 19.4% |
| Albanians | 99.3 /100 | #78 | Exceptional 19.4% |
| Immigrants | Sierra Leone | 99.3 /100 | #79 | Exceptional 19.4% |
| Immigrants | Australia | 99.3 /100 | #80 | Exceptional 19.4% |
| Immigrants | Scotland | 99.2 /100 | #81 | Exceptional 19.4% |
| Immigrants | Malaysia | 99.2 /100 | #82 | Exceptional 19.4% |
| Taiwanese | 99.2 /100 | #83 | Exceptional 19.4% |
| Immigrants | Sweden | 99.2 /100 | #84 | Exceptional 19.4% |
| Immigrants | Albania | 99.2 /100 | #85 | Exceptional 19.4% |
| Greeks | 99.2 /100 | #86 | Exceptional 19.4% |
| Zimbabweans | 99.0 /100 | #87 | Exceptional 19.5% |
| Afghans | 99.0 /100 | #88 | Exceptional 19.5% |
| Immigrants | Ukraine | 99.0 /100 | #89 | Exceptional 19.5% |