Israeli vs Northern European Single Female Poverty
COMPARE
Israeli
Northern European
Single Female Poverty
Single Female Poverty Comparison
Israelis
Northern Europeans
19.9%
SINGLE FEMALE POVERTY
96.9/ 100
METRIC RATING
105th/ 347
METRIC RANK
20.8%
SINGLE FEMALE POVERTY
68.4/ 100
METRIC RATING
162nd/ 347
METRIC RANK
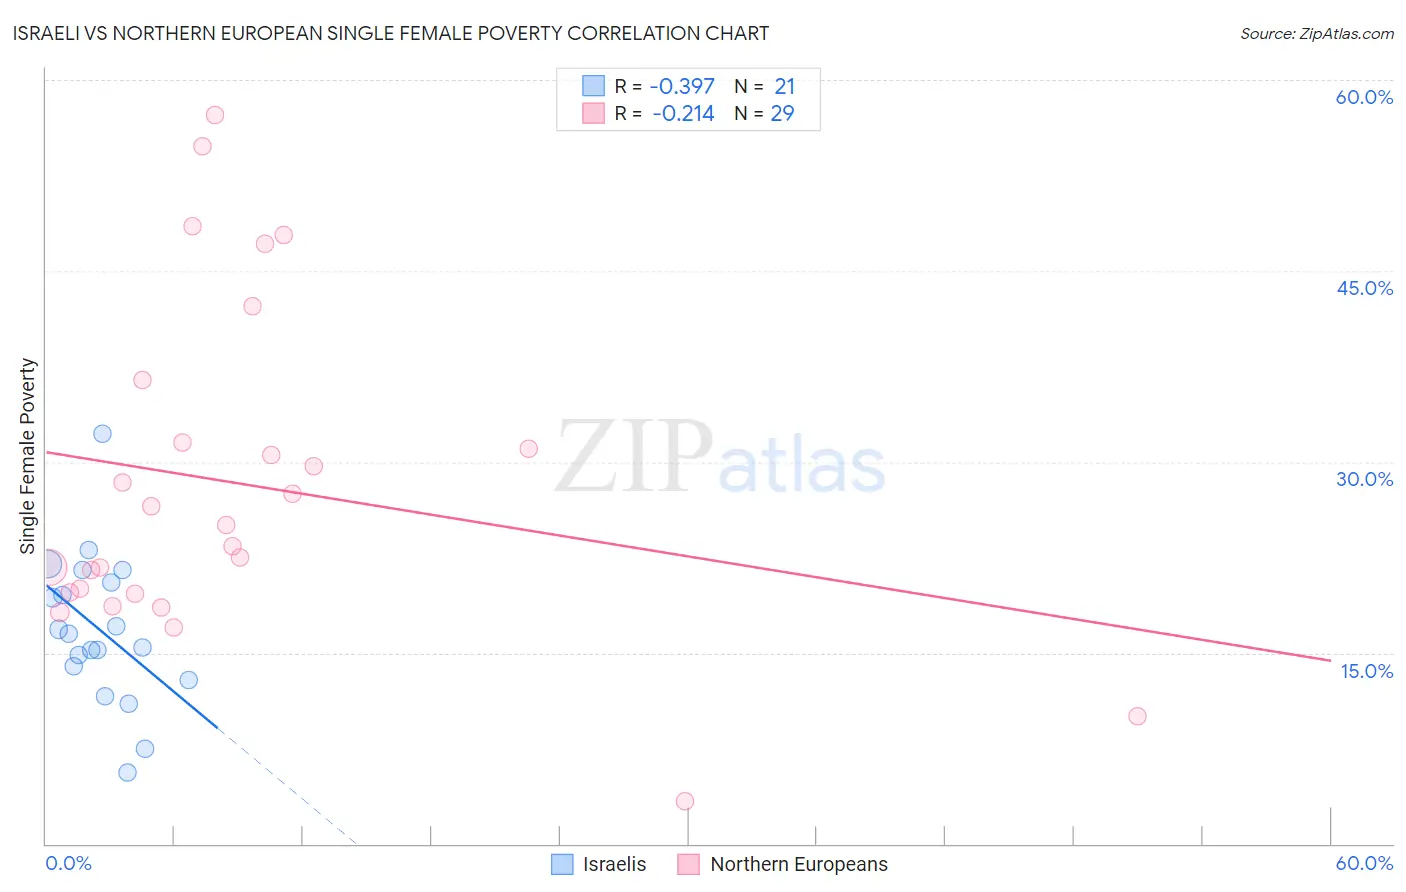
Israeli vs Northern European Single Female Poverty Correlation Chart
The statistical analysis conducted on geographies consisting of 208,686,807 people shows a mild negative correlation between the proportion of Israelis and poverty level among single females in the United States with a correlation coefficient (R) of -0.397 and weighted average of 19.9%. Similarly, the statistical analysis conducted on geographies consisting of 398,261,787 people shows a weak negative correlation between the proportion of Northern Europeans and poverty level among single females in the United States with a correlation coefficient (R) of -0.214 and weighted average of 20.8%, a difference of 4.4%.
Single Female Poverty Correlation Summary
| Measurement | Israeli | Northern European |
| Minimum | 5.6% | 3.3% |
| Maximum | 32.2% | 57.3% |
| Range | 26.6% | 54.0% |
| Mean | 16.8% | 28.3% |
| Median | 16.5% | 25.0% |
| Interquartile 25% (IQ1) | 13.4% | 19.7% |
| Interquartile 75% (IQ3) | 21.0% | 34.0% |
| Interquartile Range (IQR) | 7.6% | 14.3% |
| Standard Deviation (Sample) | 5.8% | 13.0% |
| Standard Deviation (Population) | 5.7% | 12.8% |
Similar Demographics by Single Female Poverty
Demographics Similar to Israelis by Single Female Poverty
In terms of single female poverty, the demographic groups most similar to Israelis are Chilean (19.9%, a difference of 0.010%), Ethiopian (19.9%, a difference of 0.090%), Immigrants from Syria (19.9%, a difference of 0.11%), Immigrants from Southern Europe (19.9%, a difference of 0.13%), and Native Hawaiian (19.9%, a difference of 0.16%).
| Demographics | Rating | Rank | Single Female Poverty |
| Immigrants | France | 97.9 /100 | #98 | Exceptional 19.7% |
| Sierra Leoneans | 97.9 /100 | #99 | Exceptional 19.7% |
| Ukrainians | 97.6 /100 | #100 | Exceptional 19.8% |
| Immigrants | Belgium | 97.3 /100 | #101 | Exceptional 19.8% |
| Immigrants | Cameroon | 97.3 /100 | #102 | Exceptional 19.8% |
| Immigrants | Southern Europe | 97.1 /100 | #103 | Exceptional 19.9% |
| Chileans | 96.9 /100 | #104 | Exceptional 19.9% |
| Israelis | 96.9 /100 | #105 | Exceptional 19.9% |
| Ethiopians | 96.7 /100 | #106 | Exceptional 19.9% |
| Immigrants | Syria | 96.7 /100 | #107 | Exceptional 19.9% |
| Native Hawaiians | 96.6 /100 | #108 | Exceptional 19.9% |
| Colombians | 96.6 /100 | #109 | Exceptional 19.9% |
| Immigrants | Western Asia | 96.5 /100 | #110 | Exceptional 19.9% |
| Carpatho Rusyns | 96.1 /100 | #111 | Exceptional 20.0% |
| Immigrants | Netherlands | 96.0 /100 | #112 | Exceptional 20.0% |
Demographics Similar to Northern Europeans by Single Female Poverty
In terms of single female poverty, the demographic groups most similar to Northern Europeans are Kenyan (20.8%, a difference of 0.010%), Lebanese (20.8%, a difference of 0.050%), Arab (20.7%, a difference of 0.18%), Costa Rican (20.7%, a difference of 0.26%), and Iraqi (20.8%, a difference of 0.27%).
| Demographics | Rating | Rank | Single Female Poverty |
| Samoans | 76.0 /100 | #155 | Good 20.6% |
| South American Indians | 75.7 /100 | #156 | Good 20.6% |
| Immigrants | Oceania | 74.3 /100 | #157 | Good 20.7% |
| Danes | 73.0 /100 | #158 | Good 20.7% |
| Costa Ricans | 71.8 /100 | #159 | Good 20.7% |
| Arabs | 70.8 /100 | #160 | Good 20.7% |
| Kenyans | 68.5 /100 | #161 | Good 20.8% |
| Northern Europeans | 68.4 /100 | #162 | Good 20.8% |
| Lebanese | 67.6 /100 | #163 | Good 20.8% |
| Iraqis | 64.5 /100 | #164 | Good 20.8% |
| Ugandans | 64.0 /100 | #165 | Good 20.8% |
| Norwegians | 63.0 /100 | #166 | Good 20.8% |
| Immigrants | Norway | 63.0 /100 | #167 | Good 20.8% |
| Immigrants | Costa Rica | 61.5 /100 | #168 | Good 20.9% |
| Immigrants | Trinidad and Tobago | 56.3 /100 | #169 | Average 20.9% |