Honduran vs Northern European Single Female Poverty
COMPARE
Honduran
Northern European
Single Female Poverty
Single Female Poverty Comparison
Hondurans
Northern Europeans
25.1%
SINGLE FEMALE POVERTY
0.0/ 100
METRIC RATING
301st/ 347
METRIC RANK
20.8%
SINGLE FEMALE POVERTY
68.4/ 100
METRIC RATING
162nd/ 347
METRIC RANK
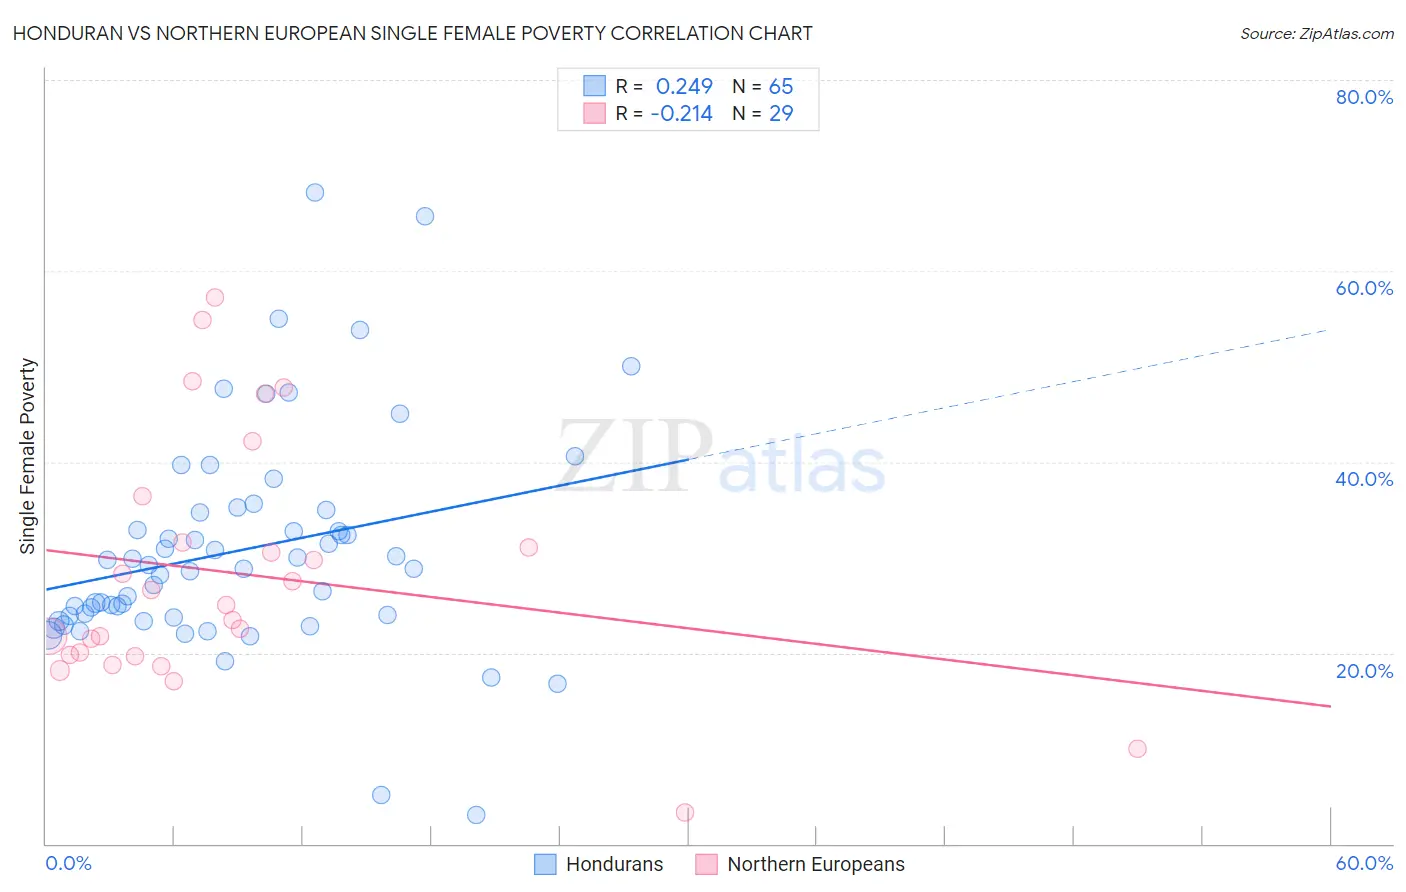
Honduran vs Northern European Single Female Poverty Correlation Chart
The statistical analysis conducted on geographies consisting of 354,754,258 people shows a weak positive correlation between the proportion of Hondurans and poverty level among single females in the United States with a correlation coefficient (R) of 0.249 and weighted average of 25.1%. Similarly, the statistical analysis conducted on geographies consisting of 398,261,787 people shows a weak negative correlation between the proportion of Northern Europeans and poverty level among single females in the United States with a correlation coefficient (R) of -0.214 and weighted average of 20.8%, a difference of 20.9%.
Single Female Poverty Correlation Summary
| Measurement | Honduran | Northern European |
| Minimum | 3.0% | 3.3% |
| Maximum | 68.3% | 57.3% |
| Range | 65.3% | 54.0% |
| Mean | 30.7% | 28.3% |
| Median | 28.8% | 25.0% |
| Interquartile 25% (IQ1) | 23.8% | 19.7% |
| Interquartile 75% (IQ3) | 34.8% | 34.0% |
| Interquartile Range (IQR) | 11.0% | 14.3% |
| Standard Deviation (Sample) | 11.6% | 13.0% |
| Standard Deviation (Population) | 11.6% | 12.8% |
Similar Demographics by Single Female Poverty
Demographics Similar to Hondurans by Single Female Poverty
In terms of single female poverty, the demographic groups most similar to Hondurans are Shoshone (25.1%, a difference of 0.090%), Blackfeet (25.1%, a difference of 0.18%), Mexican (25.0%, a difference of 0.25%), Somali (25.2%, a difference of 0.48%), and Immigrants from Congo (25.3%, a difference of 0.75%).
| Demographics | Rating | Rank | Single Female Poverty |
| French American Indians | 0.0 /100 | #294 | Tragic 24.6% |
| Hispanics or Latinos | 0.0 /100 | #295 | Tragic 24.6% |
| Africans | 0.0 /100 | #296 | Tragic 24.8% |
| Immigrants | Central America | 0.0 /100 | #297 | Tragic 24.8% |
| Yaqui | 0.0 /100 | #298 | Tragic 24.9% |
| Mexicans | 0.0 /100 | #299 | Tragic 25.0% |
| Blackfeet | 0.0 /100 | #300 | Tragic 25.1% |
| Hondurans | 0.0 /100 | #301 | Tragic 25.1% |
| Shoshone | 0.0 /100 | #302 | Tragic 25.1% |
| Somalis | 0.0 /100 | #303 | Tragic 25.2% |
| Immigrants | Congo | 0.0 /100 | #304 | Tragic 25.3% |
| Immigrants | Dominican Republic | 0.0 /100 | #305 | Tragic 25.3% |
| Immigrants | Mexico | 0.0 /100 | #306 | Tragic 25.3% |
| Potawatomi | 0.0 /100 | #307 | Tragic 25.4% |
| Aleuts | 0.0 /100 | #308 | Tragic 25.4% |
Demographics Similar to Northern Europeans by Single Female Poverty
In terms of single female poverty, the demographic groups most similar to Northern Europeans are Kenyan (20.8%, a difference of 0.010%), Lebanese (20.8%, a difference of 0.050%), Arab (20.7%, a difference of 0.18%), Costa Rican (20.7%, a difference of 0.26%), and Iraqi (20.8%, a difference of 0.27%).
| Demographics | Rating | Rank | Single Female Poverty |
| Samoans | 76.0 /100 | #155 | Good 20.6% |
| South American Indians | 75.7 /100 | #156 | Good 20.6% |
| Immigrants | Oceania | 74.3 /100 | #157 | Good 20.7% |
| Danes | 73.0 /100 | #158 | Good 20.7% |
| Costa Ricans | 71.8 /100 | #159 | Good 20.7% |
| Arabs | 70.8 /100 | #160 | Good 20.7% |
| Kenyans | 68.5 /100 | #161 | Good 20.8% |
| Northern Europeans | 68.4 /100 | #162 | Good 20.8% |
| Lebanese | 67.6 /100 | #163 | Good 20.8% |
| Iraqis | 64.5 /100 | #164 | Good 20.8% |
| Ugandans | 64.0 /100 | #165 | Good 20.8% |
| Norwegians | 63.0 /100 | #166 | Good 20.8% |
| Immigrants | Norway | 63.0 /100 | #167 | Good 20.8% |
| Immigrants | Costa Rica | 61.5 /100 | #168 | Good 20.9% |
| Immigrants | Trinidad and Tobago | 56.3 /100 | #169 | Average 20.9% |