Immigrants from Portugal vs Northern European Single Female Poverty
COMPARE
Immigrants from Portugal
Northern European
Single Female Poverty
Single Female Poverty Comparison
Immigrants from Portugal
Northern Europeans
21.9%
SINGLE FEMALE POVERTY
5.8/ 100
METRIC RATING
226th/ 347
METRIC RANK
20.8%
SINGLE FEMALE POVERTY
68.4/ 100
METRIC RATING
162nd/ 347
METRIC RANK
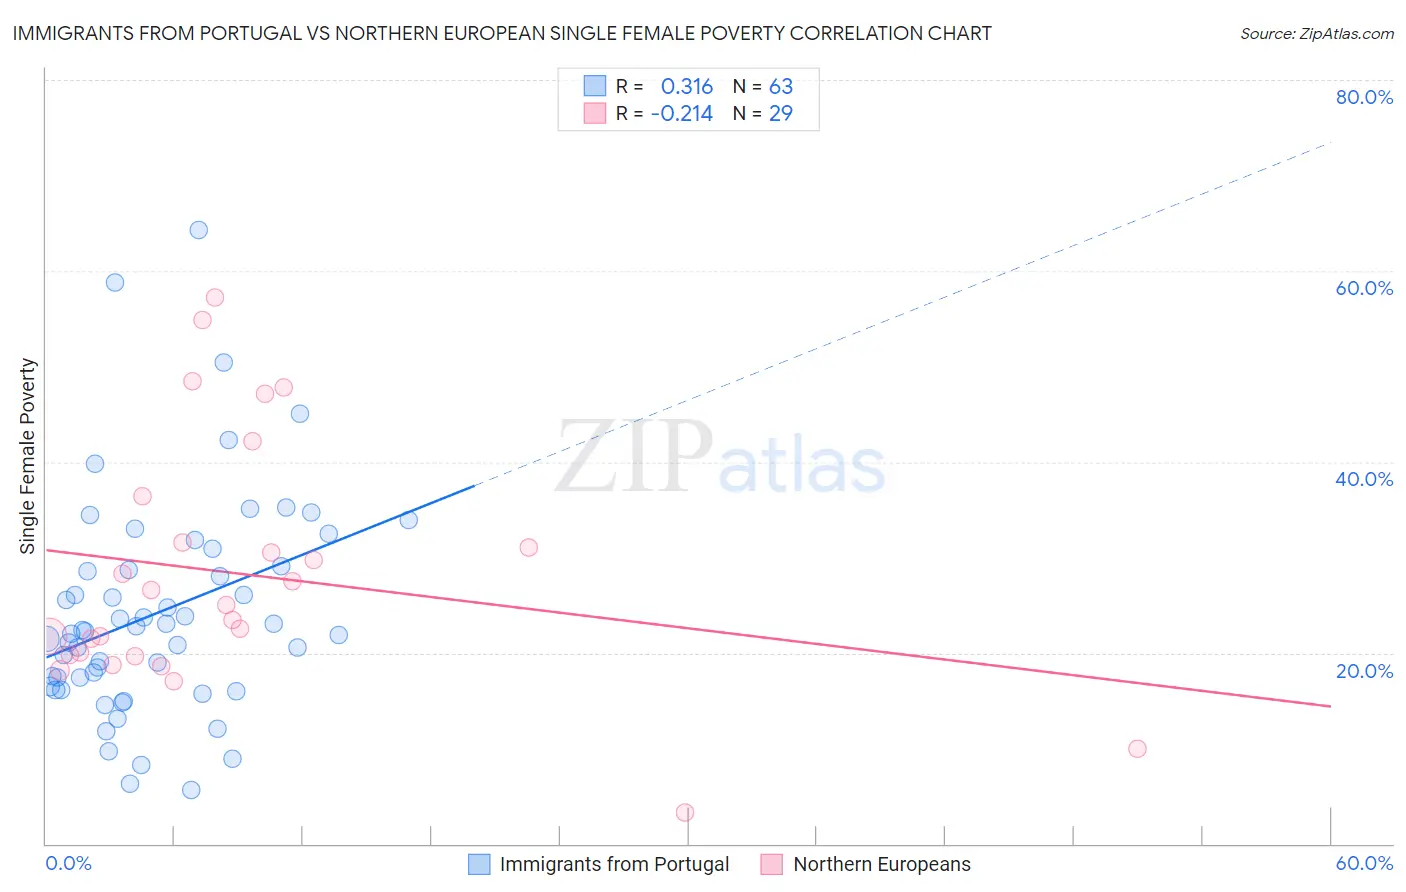
Immigrants from Portugal vs Northern European Single Female Poverty Correlation Chart
The statistical analysis conducted on geographies consisting of 172,894,894 people shows a mild positive correlation between the proportion of Immigrants from Portugal and poverty level among single females in the United States with a correlation coefficient (R) of 0.316 and weighted average of 21.9%. Similarly, the statistical analysis conducted on geographies consisting of 398,261,787 people shows a weak negative correlation between the proportion of Northern Europeans and poverty level among single females in the United States with a correlation coefficient (R) of -0.214 and weighted average of 20.8%, a difference of 5.6%.
Single Female Poverty Correlation Summary
| Measurement | Immigrants from Portugal | Northern European |
| Minimum | 5.7% | 3.3% |
| Maximum | 64.3% | 57.3% |
| Range | 58.6% | 54.0% |
| Mean | 24.2% | 28.3% |
| Median | 22.2% | 25.0% |
| Interquartile 25% (IQ1) | 16.5% | 19.7% |
| Interquartile 75% (IQ3) | 29.1% | 34.0% |
| Interquartile Range (IQR) | 12.6% | 14.3% |
| Standard Deviation (Sample) | 11.5% | 13.0% |
| Standard Deviation (Population) | 11.4% | 12.8% |
Similar Demographics by Single Female Poverty
Demographics Similar to Immigrants from Portugal by Single Female Poverty
In terms of single female poverty, the demographic groups most similar to Immigrants from Portugal are Immigrants from Ghana (21.9%, a difference of 0.0%), Salvadoran (21.9%, a difference of 0.10%), Tlingit-Haida (21.9%, a difference of 0.13%), Immigrants from Western Africa (22.0%, a difference of 0.15%), and English (21.9%, a difference of 0.16%).
| Demographics | Rating | Rank | Single Female Poverty |
| Panamanians | 9.4 /100 | #219 | Tragic 21.7% |
| Germans | 8.3 /100 | #220 | Tragic 21.8% |
| Immigrants | Grenada | 8.0 /100 | #221 | Tragic 21.8% |
| Immigrants | Eritrea | 7.9 /100 | #222 | Tragic 21.8% |
| Scottish | 7.3 /100 | #223 | Tragic 21.8% |
| Barbadians | 7.2 /100 | #224 | Tragic 21.8% |
| English | 6.4 /100 | #225 | Tragic 21.9% |
| Immigrants | Portugal | 5.8 /100 | #226 | Tragic 21.9% |
| Immigrants | Ghana | 5.8 /100 | #227 | Tragic 21.9% |
| Salvadorans | 5.5 /100 | #228 | Tragic 21.9% |
| Tlingit-Haida | 5.4 /100 | #229 | Tragic 21.9% |
| Immigrants | Western Africa | 5.3 /100 | #230 | Tragic 22.0% |
| Welsh | 5.0 /100 | #231 | Tragic 22.0% |
| Immigrants | Thailand | 5.0 /100 | #232 | Tragic 22.0% |
| Spaniards | 4.7 /100 | #233 | Tragic 22.0% |
Demographics Similar to Northern Europeans by Single Female Poverty
In terms of single female poverty, the demographic groups most similar to Northern Europeans are Kenyan (20.8%, a difference of 0.010%), Lebanese (20.8%, a difference of 0.050%), Arab (20.7%, a difference of 0.18%), Costa Rican (20.7%, a difference of 0.26%), and Iraqi (20.8%, a difference of 0.27%).
| Demographics | Rating | Rank | Single Female Poverty |
| Samoans | 76.0 /100 | #155 | Good 20.6% |
| South American Indians | 75.7 /100 | #156 | Good 20.6% |
| Immigrants | Oceania | 74.3 /100 | #157 | Good 20.7% |
| Danes | 73.0 /100 | #158 | Good 20.7% |
| Costa Ricans | 71.8 /100 | #159 | Good 20.7% |
| Arabs | 70.8 /100 | #160 | Good 20.7% |
| Kenyans | 68.5 /100 | #161 | Good 20.8% |
| Northern Europeans | 68.4 /100 | #162 | Good 20.8% |
| Lebanese | 67.6 /100 | #163 | Good 20.8% |
| Iraqis | 64.5 /100 | #164 | Good 20.8% |
| Ugandans | 64.0 /100 | #165 | Good 20.8% |
| Norwegians | 63.0 /100 | #166 | Good 20.8% |
| Immigrants | Norway | 63.0 /100 | #167 | Good 20.8% |
| Immigrants | Costa Rica | 61.5 /100 | #168 | Good 20.9% |
| Immigrants | Trinidad and Tobago | 56.3 /100 | #169 | Average 20.9% |