Slovak vs Northern European Single Female Poverty
COMPARE
Slovak
Northern European
Single Female Poverty
Single Female Poverty Comparison
Slovaks
Northern Europeans
21.1%
SINGLE FEMALE POVERTY
39.7/ 100
METRIC RATING
183rd/ 347
METRIC RANK
20.8%
SINGLE FEMALE POVERTY
68.4/ 100
METRIC RATING
162nd/ 347
METRIC RANK
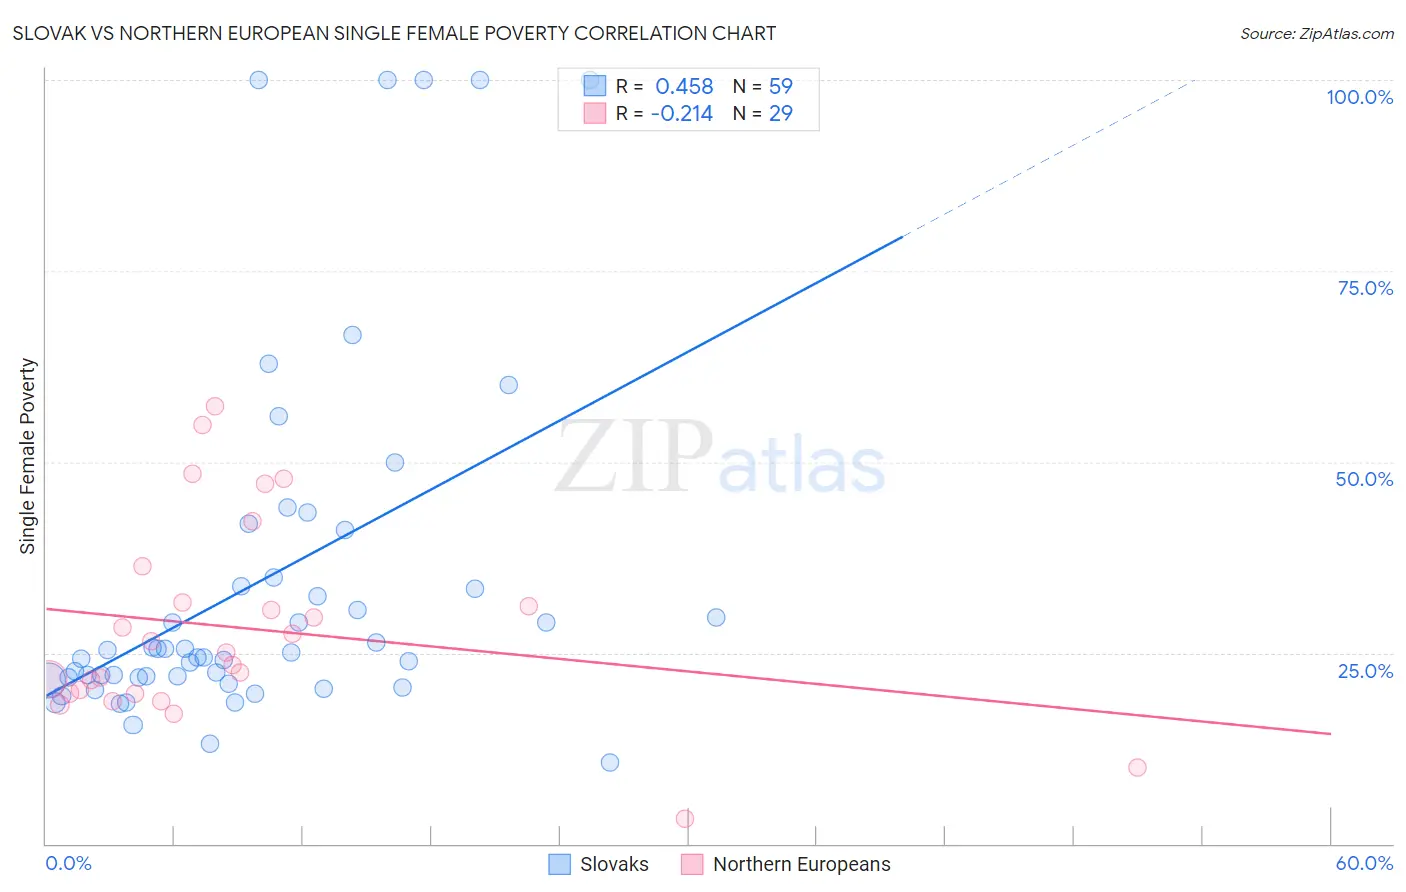
Slovak vs Northern European Single Female Poverty Correlation Chart
The statistical analysis conducted on geographies consisting of 389,214,843 people shows a moderate positive correlation between the proportion of Slovaks and poverty level among single females in the United States with a correlation coefficient (R) of 0.458 and weighted average of 21.1%. Similarly, the statistical analysis conducted on geographies consisting of 398,261,787 people shows a weak negative correlation between the proportion of Northern Europeans and poverty level among single females in the United States with a correlation coefficient (R) of -0.214 and weighted average of 20.8%, a difference of 1.9%.
Single Female Poverty Correlation Summary
| Measurement | Slovak | Northern European |
| Minimum | 10.7% | 3.3% |
| Maximum | 100.0% | 57.3% |
| Range | 89.3% | 54.0% |
| Mean | 34.3% | 28.3% |
| Median | 25.1% | 25.0% |
| Interquartile 25% (IQ1) | 21.8% | 19.7% |
| Interquartile 75% (IQ3) | 34.8% | 34.0% |
| Interquartile Range (IQR) | 13.0% | 14.3% |
| Standard Deviation (Sample) | 23.3% | 13.0% |
| Standard Deviation (Population) | 23.1% | 12.8% |
Similar Demographics by Single Female Poverty
Demographics Similar to Slovaks by Single Female Poverty
In terms of single female poverty, the demographic groups most similar to Slovaks are Hungarian (21.1%, a difference of 0.010%), Slavic (21.1%, a difference of 0.050%), Immigrants from Cambodia (21.2%, a difference of 0.10%), Hawaiian (21.2%, a difference of 0.14%), and Spanish American Indian (21.1%, a difference of 0.17%).
| Demographics | Rating | Rank | Single Female Poverty |
| Canadians | 45.4 /100 | #176 | Average 21.1% |
| Scandinavians | 45.2 /100 | #177 | Average 21.1% |
| Immigrants | Bosnia and Herzegovina | 44.9 /100 | #178 | Average 21.1% |
| British | 42.9 /100 | #179 | Average 21.1% |
| Spanish American Indians | 42.5 /100 | #180 | Average 21.1% |
| Europeans | 42.3 /100 | #181 | Average 21.1% |
| Slavs | 40.5 /100 | #182 | Average 21.1% |
| Slovaks | 39.7 /100 | #183 | Fair 21.1% |
| Hungarians | 39.6 /100 | #184 | Fair 21.1% |
| Immigrants | Cambodia | 38.2 /100 | #185 | Fair 21.2% |
| Hawaiians | 37.7 /100 | #186 | Fair 21.2% |
| Immigrants | Nigeria | 36.8 /100 | #187 | Fair 21.2% |
| Yugoslavians | 35.4 /100 | #188 | Fair 21.2% |
| Immigrants | Cuba | 35.3 /100 | #189 | Fair 21.2% |
| Trinidadians and Tobagonians | 35.2 /100 | #190 | Fair 21.2% |
Demographics Similar to Northern Europeans by Single Female Poverty
In terms of single female poverty, the demographic groups most similar to Northern Europeans are Kenyan (20.8%, a difference of 0.010%), Lebanese (20.8%, a difference of 0.050%), Arab (20.7%, a difference of 0.18%), Costa Rican (20.7%, a difference of 0.26%), and Iraqi (20.8%, a difference of 0.27%).
| Demographics | Rating | Rank | Single Female Poverty |
| Samoans | 76.0 /100 | #155 | Good 20.6% |
| South American Indians | 75.7 /100 | #156 | Good 20.6% |
| Immigrants | Oceania | 74.3 /100 | #157 | Good 20.7% |
| Danes | 73.0 /100 | #158 | Good 20.7% |
| Costa Ricans | 71.8 /100 | #159 | Good 20.7% |
| Arabs | 70.8 /100 | #160 | Good 20.7% |
| Kenyans | 68.5 /100 | #161 | Good 20.8% |
| Northern Europeans | 68.4 /100 | #162 | Good 20.8% |
| Lebanese | 67.6 /100 | #163 | Good 20.8% |
| Iraqis | 64.5 /100 | #164 | Good 20.8% |
| Ugandans | 64.0 /100 | #165 | Good 20.8% |
| Norwegians | 63.0 /100 | #166 | Good 20.8% |
| Immigrants | Norway | 63.0 /100 | #167 | Good 20.8% |
| Immigrants | Costa Rica | 61.5 /100 | #168 | Good 20.9% |
| Immigrants | Trinidad and Tobago | 56.3 /100 | #169 | Average 20.9% |