Immigrants from Iran vs Northern European Single Female Poverty
COMPARE
Immigrants from Iran
Northern European
Single Female Poverty
Single Female Poverty Comparison
Immigrants from Iran
Northern Europeans
17.5%
SINGLE FEMALE POVERTY
100.0/ 100
METRIC RATING
8th/ 347
METRIC RANK
20.8%
SINGLE FEMALE POVERTY
68.4/ 100
METRIC RATING
162nd/ 347
METRIC RANK
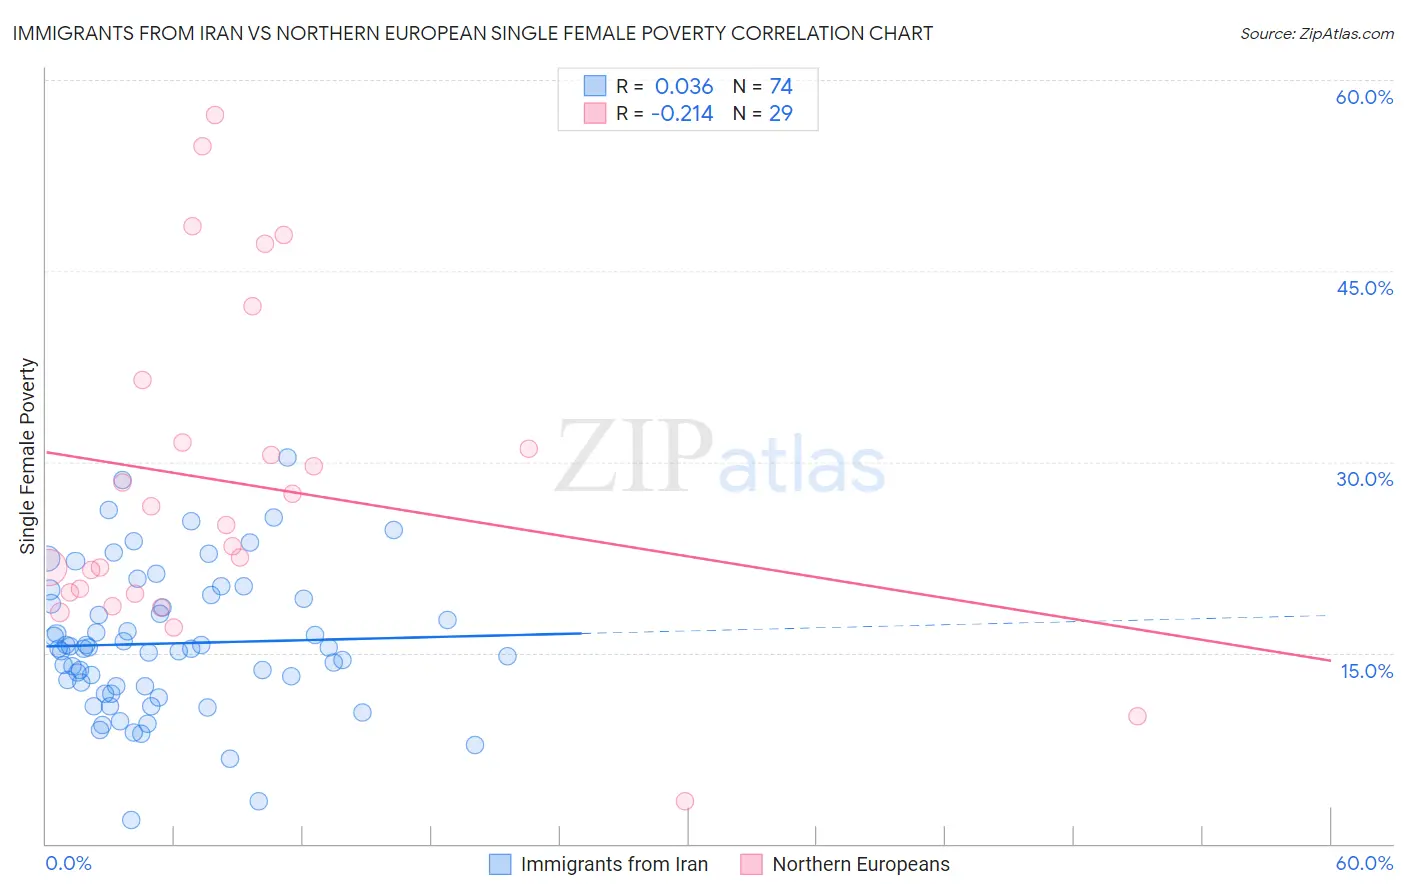
Immigrants from Iran vs Northern European Single Female Poverty Correlation Chart
The statistical analysis conducted on geographies consisting of 276,267,918 people shows no correlation between the proportion of Immigrants from Iran and poverty level among single females in the United States with a correlation coefficient (R) of 0.036 and weighted average of 17.5%. Similarly, the statistical analysis conducted on geographies consisting of 398,261,787 people shows a weak negative correlation between the proportion of Northern Europeans and poverty level among single females in the United States with a correlation coefficient (R) of -0.214 and weighted average of 20.8%, a difference of 18.9%.
Single Female Poverty Correlation Summary
| Measurement | Immigrants from Iran | Northern European |
| Minimum | 1.9% | 3.3% |
| Maximum | 30.4% | 57.3% |
| Range | 28.5% | 54.0% |
| Mean | 15.7% | 28.3% |
| Median | 15.3% | 25.0% |
| Interquartile 25% (IQ1) | 12.3% | 19.7% |
| Interquartile 75% (IQ3) | 19.3% | 34.0% |
| Interquartile Range (IQR) | 6.9% | 14.3% |
| Standard Deviation (Sample) | 5.6% | 13.0% |
| Standard Deviation (Population) | 5.5% | 12.8% |
Similar Demographics by Single Female Poverty
Demographics Similar to Immigrants from Iran by Single Female Poverty
In terms of single female poverty, the demographic groups most similar to Immigrants from Iran are Thai (17.3%, a difference of 0.99%), Bhutanese (17.7%, a difference of 1.4%), Immigrants from Ireland (17.8%, a difference of 1.8%), Immigrants from Lithuania (17.8%, a difference of 1.9%), and Immigrants from South Central Asia (17.8%, a difference of 2.0%).
| Demographics | Rating | Rank | Single Female Poverty |
| Chinese | 100.0 /100 | #1 | Exceptional 16.1% |
| Immigrants | Taiwan | 100.0 /100 | #2 | Exceptional 16.4% |
| Immigrants | Hong Kong | 100.0 /100 | #3 | Exceptional 16.5% |
| Immigrants | India | 100.0 /100 | #4 | Exceptional 16.8% |
| Assyrians/Chaldeans/Syriacs | 100.0 /100 | #5 | Exceptional 17.0% |
| Filipinos | 100.0 /100 | #6 | Exceptional 17.0% |
| Thais | 100.0 /100 | #7 | Exceptional 17.3% |
| Immigrants | Iran | 100.0 /100 | #8 | Exceptional 17.5% |
| Bhutanese | 100.0 /100 | #9 | Exceptional 17.7% |
| Immigrants | Ireland | 100.0 /100 | #10 | Exceptional 17.8% |
| Immigrants | Lithuania | 100.0 /100 | #11 | Exceptional 17.8% |
| Immigrants | South Central Asia | 100.0 /100 | #12 | Exceptional 17.8% |
| Immigrants | Bolivia | 100.0 /100 | #13 | Exceptional 17.8% |
| Bolivians | 100.0 /100 | #14 | Exceptional 17.9% |
| Indians (Asian) | 100.0 /100 | #15 | Exceptional 17.9% |
Demographics Similar to Northern Europeans by Single Female Poverty
In terms of single female poverty, the demographic groups most similar to Northern Europeans are Kenyan (20.8%, a difference of 0.010%), Lebanese (20.8%, a difference of 0.050%), Arab (20.7%, a difference of 0.18%), Costa Rican (20.7%, a difference of 0.26%), and Iraqi (20.8%, a difference of 0.27%).
| Demographics | Rating | Rank | Single Female Poverty |
| Samoans | 76.0 /100 | #155 | Good 20.6% |
| South American Indians | 75.7 /100 | #156 | Good 20.6% |
| Immigrants | Oceania | 74.3 /100 | #157 | Good 20.7% |
| Danes | 73.0 /100 | #158 | Good 20.7% |
| Costa Ricans | 71.8 /100 | #159 | Good 20.7% |
| Arabs | 70.8 /100 | #160 | Good 20.7% |
| Kenyans | 68.5 /100 | #161 | Good 20.8% |
| Northern Europeans | 68.4 /100 | #162 | Good 20.8% |
| Lebanese | 67.6 /100 | #163 | Good 20.8% |
| Iraqis | 64.5 /100 | #164 | Good 20.8% |
| Ugandans | 64.0 /100 | #165 | Good 20.8% |
| Norwegians | 63.0 /100 | #166 | Good 20.8% |
| Immigrants | Norway | 63.0 /100 | #167 | Good 20.8% |
| Immigrants | Costa Rica | 61.5 /100 | #168 | Good 20.9% |
| Immigrants | Trinidad and Tobago | 56.3 /100 | #169 | Average 20.9% |