Immigrants from Micronesia vs Immigrants from Hong Kong Female Poverty
COMPARE
Immigrants from Micronesia
Immigrants from Hong Kong
Female Poverty
Female Poverty Comparison
Immigrants from Micronesia
Immigrants from Hong Kong
14.6%
FEMALE POVERTY
2.8/ 100
METRIC RATING
225th/ 347
METRIC RANK
11.2%
FEMALE POVERTY
99.9/ 100
METRIC RATING
10th/ 347
METRIC RANK
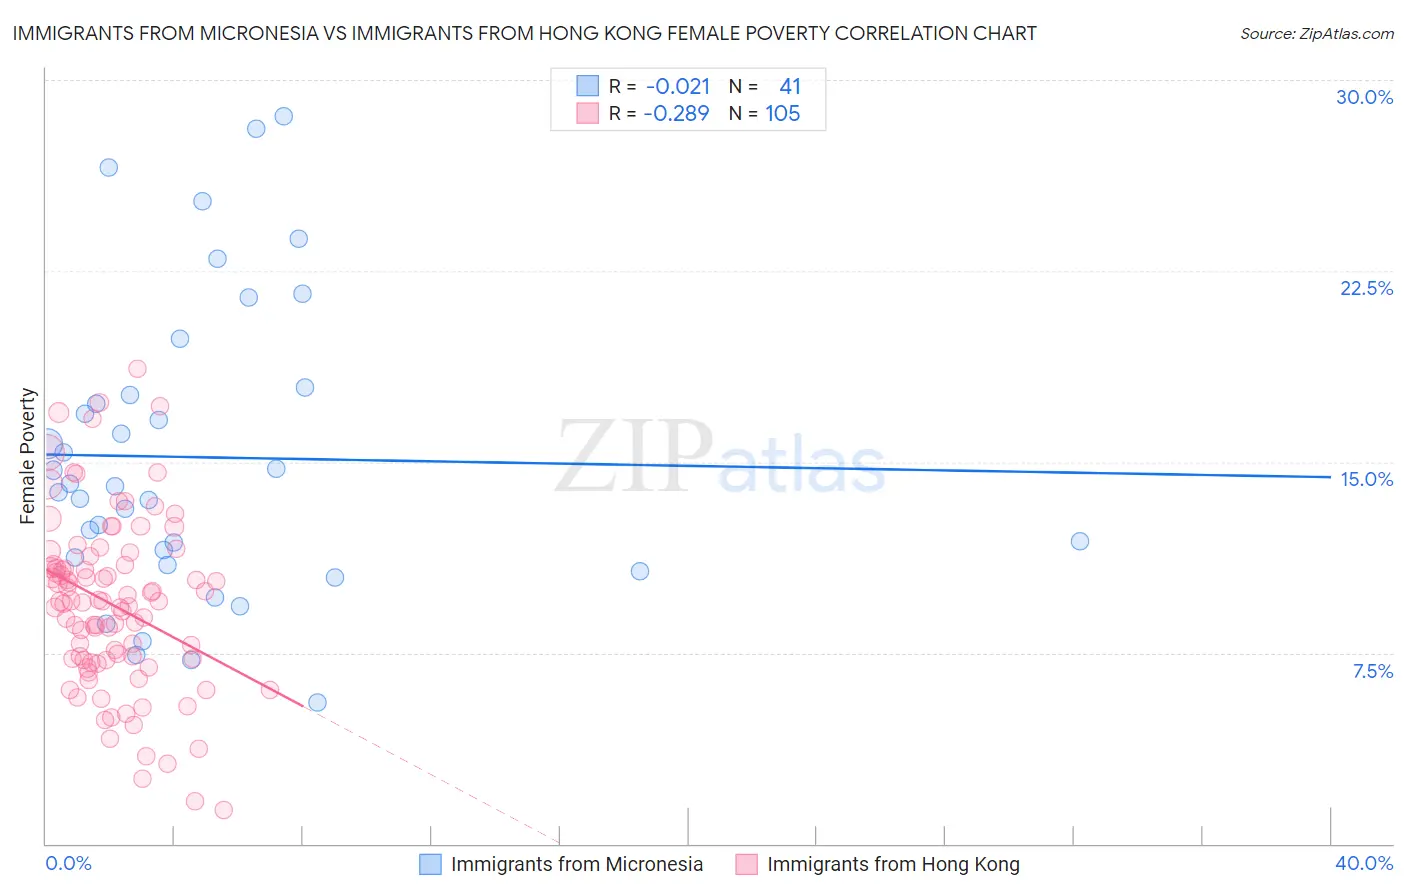
Immigrants from Micronesia vs Immigrants from Hong Kong Female Poverty Correlation Chart
The statistical analysis conducted on geographies consisting of 61,598,516 people shows no correlation between the proportion of Immigrants from Micronesia and poverty level among females in the United States with a correlation coefficient (R) of -0.021 and weighted average of 14.6%. Similarly, the statistical analysis conducted on geographies consisting of 253,845,930 people shows a weak negative correlation between the proportion of Immigrants from Hong Kong and poverty level among females in the United States with a correlation coefficient (R) of -0.289 and weighted average of 11.2%, a difference of 30.0%.
Female Poverty Correlation Summary
| Measurement | Immigrants from Micronesia | Immigrants from Hong Kong |
| Minimum | 5.5% | 1.3% |
| Maximum | 28.6% | 18.6% |
| Range | 23.0% | 17.3% |
| Mean | 15.2% | 9.4% |
| Median | 14.1% | 9.5% |
| Interquartile 25% (IQ1) | 11.1% | 7.2% |
| Interquartile 75% (IQ3) | 17.8% | 10.9% |
| Interquartile Range (IQR) | 6.7% | 3.7% |
| Standard Deviation (Sample) | 5.8% | 3.4% |
| Standard Deviation (Population) | 5.7% | 3.4% |
Similar Demographics by Female Poverty
Demographics Similar to Immigrants from Micronesia by Female Poverty
In terms of female poverty, the demographic groups most similar to Immigrants from Micronesia are American (14.6%, a difference of 0.0%), Immigrants from Eritrea (14.6%, a difference of 0.33%), Immigrants from Africa (14.5%, a difference of 0.40%), Nonimmigrants (14.5%, a difference of 0.63%), and Immigrants from Nigeria (14.7%, a difference of 0.64%).
| Demographics | Rating | Rank | Female Poverty |
| Immigrants | Uzbekistan | 4.4 /100 | #218 | Tragic 14.4% |
| Japanese | 4.1 /100 | #219 | Tragic 14.5% |
| Alsatians | 4.0 /100 | #220 | Tragic 14.5% |
| Immigrants | Cambodia | 3.7 /100 | #221 | Tragic 14.5% |
| Immigrants | Nonimmigrants | 3.7 /100 | #222 | Tragic 14.5% |
| Immigrants | Africa | 3.3 /100 | #223 | Tragic 14.5% |
| Americans | 2.8 /100 | #224 | Tragic 14.6% |
| Immigrants | Micronesia | 2.8 /100 | #225 | Tragic 14.6% |
| Immigrants | Eritrea | 2.4 /100 | #226 | Tragic 14.6% |
| Immigrants | Nigeria | 2.1 /100 | #227 | Tragic 14.7% |
| German Russians | 2.0 /100 | #228 | Tragic 14.7% |
| Ghanaians | 1.9 /100 | #229 | Tragic 14.7% |
| Alaska Natives | 1.8 /100 | #230 | Tragic 14.7% |
| Nigerians | 1.7 /100 | #231 | Tragic 14.8% |
| Osage | 1.5 /100 | #232 | Tragic 14.8% |
Demographics Similar to Immigrants from Hong Kong by Female Poverty
In terms of female poverty, the demographic groups most similar to Immigrants from Hong Kong are Maltese (11.2%, a difference of 0.11%), Bhutanese (11.3%, a difference of 0.57%), Immigrants from Lithuania (11.3%, a difference of 0.58%), Bulgarian (11.1%, a difference of 0.80%), and Immigrants from South Central Asia (11.1%, a difference of 0.99%).
| Demographics | Rating | Rank | Female Poverty |
| Thais | 100.0 /100 | #3 | Exceptional 10.5% |
| Immigrants | Taiwan | 100.0 /100 | #4 | Exceptional 10.5% |
| Filipinos | 100.0 /100 | #5 | Exceptional 10.9% |
| Immigrants | Ireland | 99.9 /100 | #6 | Exceptional 11.0% |
| Assyrians/Chaldeans/Syriacs | 99.9 /100 | #7 | Exceptional 11.0% |
| Immigrants | South Central Asia | 99.9 /100 | #8 | Exceptional 11.1% |
| Bulgarians | 99.9 /100 | #9 | Exceptional 11.1% |
| Immigrants | Hong Kong | 99.9 /100 | #10 | Exceptional 11.2% |
| Maltese | 99.9 /100 | #11 | Exceptional 11.2% |
| Bhutanese | 99.9 /100 | #12 | Exceptional 11.3% |
| Immigrants | Lithuania | 99.9 /100 | #13 | Exceptional 11.3% |
| Lithuanians | 99.8 /100 | #14 | Exceptional 11.4% |
| Latvians | 99.8 /100 | #15 | Exceptional 11.4% |
| Immigrants | Bolivia | 99.8 /100 | #16 | Exceptional 11.5% |
| Bolivians | 99.8 /100 | #17 | Exceptional 11.5% |