Scandinavian vs Immigrants from Hong Kong Female Poverty
COMPARE
Scandinavian
Immigrants from Hong Kong
Female Poverty
Female Poverty Comparison
Scandinavians
Immigrants from Hong Kong
12.1%
FEMALE POVERTY
98.2/ 100
METRIC RATING
58th/ 347
METRIC RANK
11.2%
FEMALE POVERTY
99.9/ 100
METRIC RATING
10th/ 347
METRIC RANK
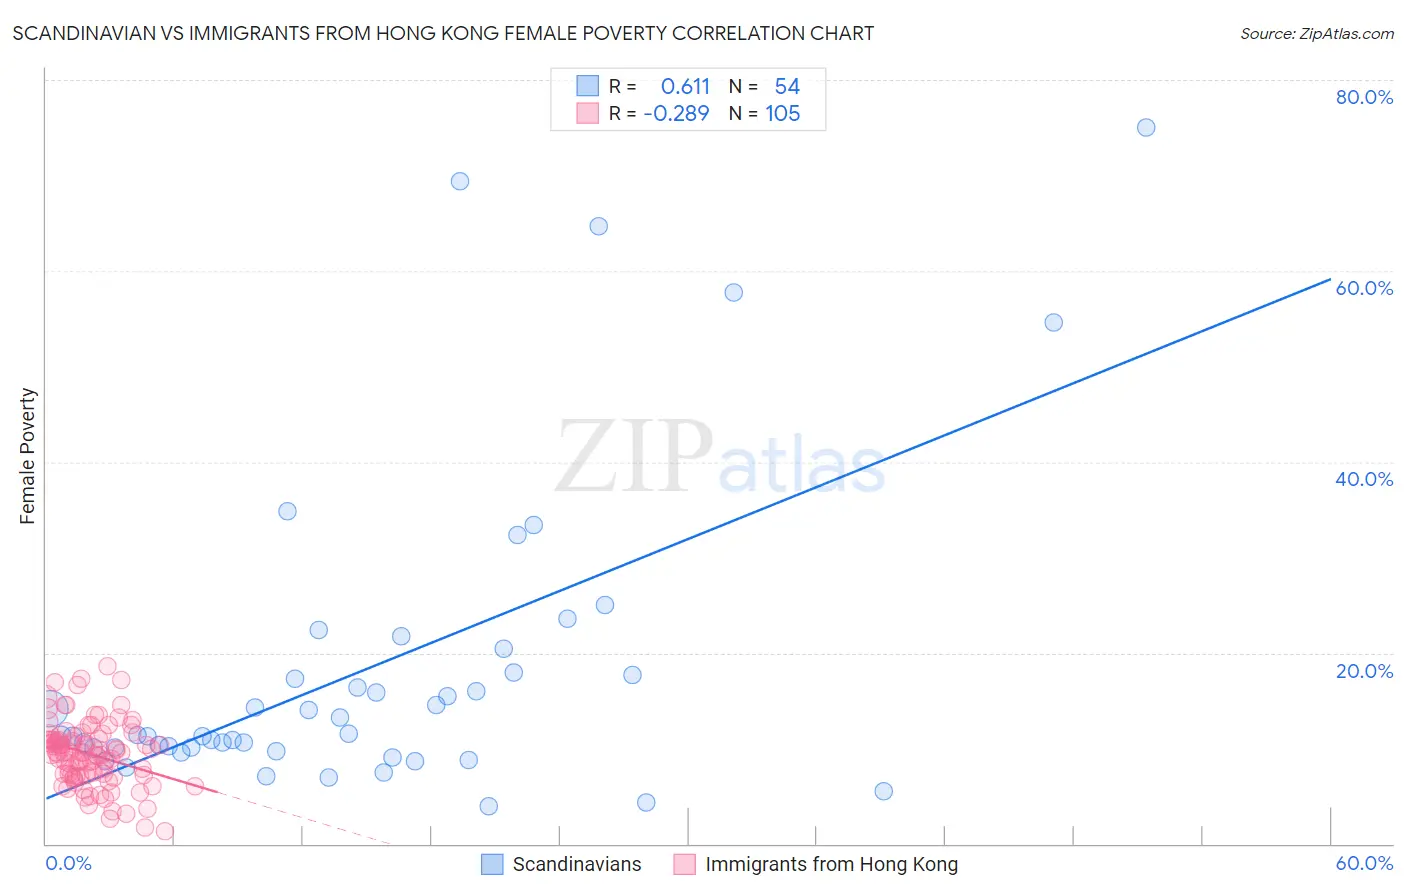
Scandinavian vs Immigrants from Hong Kong Female Poverty Correlation Chart
The statistical analysis conducted on geographies consisting of 472,075,178 people shows a significant positive correlation between the proportion of Scandinavians and poverty level among females in the United States with a correlation coefficient (R) of 0.611 and weighted average of 12.1%. Similarly, the statistical analysis conducted on geographies consisting of 253,845,930 people shows a weak negative correlation between the proportion of Immigrants from Hong Kong and poverty level among females in the United States with a correlation coefficient (R) of -0.289 and weighted average of 11.2%, a difference of 8.2%.
Female Poverty Correlation Summary
| Measurement | Scandinavian | Immigrants from Hong Kong |
| Minimum | 3.9% | 1.3% |
| Maximum | 75.0% | 18.6% |
| Range | 71.1% | 17.3% |
| Mean | 18.4% | 9.4% |
| Median | 11.3% | 9.5% |
| Interquartile 25% (IQ1) | 10.0% | 7.2% |
| Interquartile 75% (IQ3) | 18.0% | 10.9% |
| Interquartile Range (IQR) | 7.9% | 3.7% |
| Standard Deviation (Sample) | 16.4% | 3.4% |
| Standard Deviation (Population) | 16.2% | 3.4% |
Similar Demographics by Female Poverty
Demographics Similar to Scandinavians by Female Poverty
In terms of female poverty, the demographic groups most similar to Scandinavians are Immigrants from Europe (12.1%, a difference of 0.010%), Immigrants from Serbia (12.1%, a difference of 0.080%), Estonian (12.1%, a difference of 0.14%), Immigrants from Australia (12.2%, a difference of 0.25%), and Immigrants from Asia (12.2%, a difference of 0.26%).
| Demographics | Rating | Rank | Female Poverty |
| Immigrants | Bulgaria | 98.9 /100 | #51 | Exceptional 12.0% |
| Immigrants | Croatia | 98.7 /100 | #52 | Exceptional 12.0% |
| Immigrants | Austria | 98.7 /100 | #53 | Exceptional 12.0% |
| Immigrants | Philippines | 98.7 /100 | #54 | Exceptional 12.1% |
| Immigrants | Sri Lanka | 98.5 /100 | #55 | Exceptional 12.1% |
| Estonians | 98.3 /100 | #56 | Exceptional 12.1% |
| Immigrants | Serbia | 98.3 /100 | #57 | Exceptional 12.1% |
| Scandinavians | 98.2 /100 | #58 | Exceptional 12.1% |
| Immigrants | Europe | 98.2 /100 | #59 | Exceptional 12.1% |
| Immigrants | Australia | 98.1 /100 | #60 | Exceptional 12.2% |
| Immigrants | Asia | 98.1 /100 | #61 | Exceptional 12.2% |
| Immigrants | Italy | 98.0 /100 | #62 | Exceptional 12.2% |
| Ukrainians | 98.0 /100 | #63 | Exceptional 12.2% |
| Germans | 98.0 /100 | #64 | Exceptional 12.2% |
| Indians (Asian) | 97.9 /100 | #65 | Exceptional 12.2% |
Demographics Similar to Immigrants from Hong Kong by Female Poverty
In terms of female poverty, the demographic groups most similar to Immigrants from Hong Kong are Maltese (11.2%, a difference of 0.11%), Bhutanese (11.3%, a difference of 0.57%), Immigrants from Lithuania (11.3%, a difference of 0.58%), Bulgarian (11.1%, a difference of 0.80%), and Immigrants from South Central Asia (11.1%, a difference of 0.99%).
| Demographics | Rating | Rank | Female Poverty |
| Thais | 100.0 /100 | #3 | Exceptional 10.5% |
| Immigrants | Taiwan | 100.0 /100 | #4 | Exceptional 10.5% |
| Filipinos | 100.0 /100 | #5 | Exceptional 10.9% |
| Immigrants | Ireland | 99.9 /100 | #6 | Exceptional 11.0% |
| Assyrians/Chaldeans/Syriacs | 99.9 /100 | #7 | Exceptional 11.0% |
| Immigrants | South Central Asia | 99.9 /100 | #8 | Exceptional 11.1% |
| Bulgarians | 99.9 /100 | #9 | Exceptional 11.1% |
| Immigrants | Hong Kong | 99.9 /100 | #10 | Exceptional 11.2% |
| Maltese | 99.9 /100 | #11 | Exceptional 11.2% |
| Bhutanese | 99.9 /100 | #12 | Exceptional 11.3% |
| Immigrants | Lithuania | 99.9 /100 | #13 | Exceptional 11.3% |
| Lithuanians | 99.8 /100 | #14 | Exceptional 11.4% |
| Latvians | 99.8 /100 | #15 | Exceptional 11.4% |
| Immigrants | Bolivia | 99.8 /100 | #16 | Exceptional 11.5% |
| Bolivians | 99.8 /100 | #17 | Exceptional 11.5% |