Chippewa vs Immigrants from Hong Kong Female Poverty
COMPARE
Chippewa
Immigrants from Hong Kong
Female Poverty
Female Poverty Comparison
Chippewa
Immigrants from Hong Kong
16.7%
FEMALE POVERTY
0.0/ 100
METRIC RATING
302nd/ 347
METRIC RANK
11.2%
FEMALE POVERTY
99.9/ 100
METRIC RATING
10th/ 347
METRIC RANK
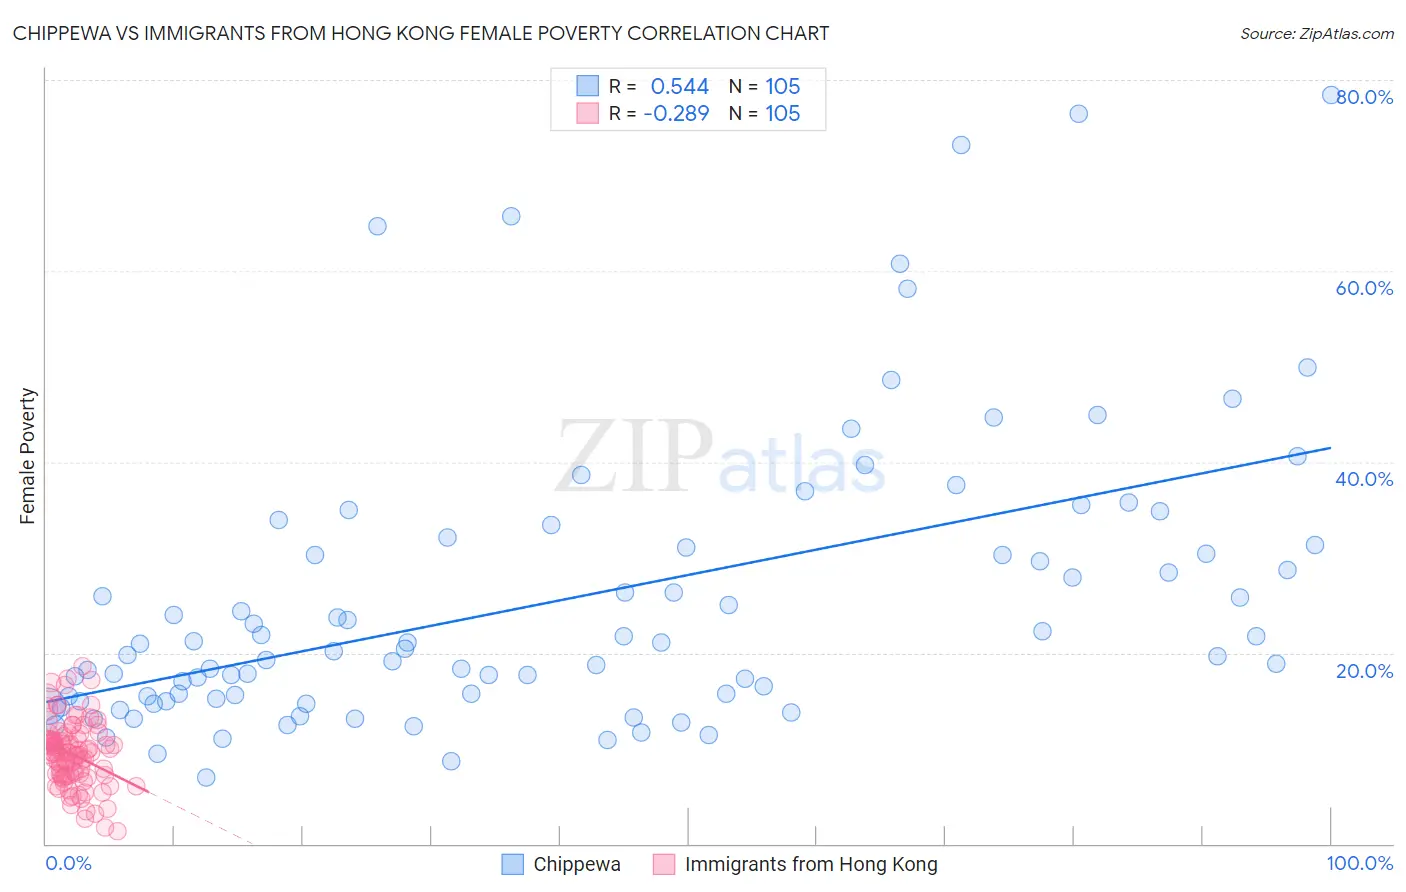
Chippewa vs Immigrants from Hong Kong Female Poverty Correlation Chart
The statistical analysis conducted on geographies consisting of 214,995,312 people shows a substantial positive correlation between the proportion of Chippewa and poverty level among females in the United States with a correlation coefficient (R) of 0.544 and weighted average of 16.7%. Similarly, the statistical analysis conducted on geographies consisting of 253,845,930 people shows a weak negative correlation between the proportion of Immigrants from Hong Kong and poverty level among females in the United States with a correlation coefficient (R) of -0.289 and weighted average of 11.2%, a difference of 48.9%.
Female Poverty Correlation Summary
| Measurement | Chippewa | Immigrants from Hong Kong |
| Minimum | 7.0% | 1.3% |
| Maximum | 78.4% | 18.6% |
| Range | 71.4% | 17.3% |
| Mean | 25.6% | 9.4% |
| Median | 20.4% | 9.5% |
| Interquartile 25% (IQ1) | 15.3% | 7.2% |
| Interquartile 75% (IQ3) | 31.2% | 10.9% |
| Interquartile Range (IQR) | 15.8% | 3.7% |
| Standard Deviation (Sample) | 15.1% | 3.4% |
| Standard Deviation (Population) | 15.0% | 3.4% |
Similar Demographics by Female Poverty
Demographics Similar to Chippewa by Female Poverty
In terms of female poverty, the demographic groups most similar to Chippewa are Guatemalan (16.7%, a difference of 0.030%), Bahamian (16.6%, a difference of 0.36%), Hispanic or Latino (16.6%, a difference of 0.40%), Choctaw (16.8%, a difference of 0.61%), and Immigrants from Central America (16.8%, a difference of 0.67%).
| Demographics | Rating | Rank | Female Poverty |
| Senegalese | 0.0 /100 | #295 | Tragic 16.5% |
| Immigrants | Senegal | 0.0 /100 | #296 | Tragic 16.5% |
| Mexicans | 0.0 /100 | #297 | Tragic 16.5% |
| Somalis | 0.0 /100 | #298 | Tragic 16.6% |
| Hispanics or Latinos | 0.0 /100 | #299 | Tragic 16.6% |
| Bahamians | 0.0 /100 | #300 | Tragic 16.6% |
| Guatemalans | 0.0 /100 | #301 | Tragic 16.7% |
| Chippewa | 0.0 /100 | #302 | Tragic 16.7% |
| Choctaw | 0.0 /100 | #303 | Tragic 16.8% |
| Immigrants | Central America | 0.0 /100 | #304 | Tragic 16.8% |
| Immigrants | Grenada | 0.0 /100 | #305 | Tragic 16.8% |
| Immigrants | Caribbean | 0.0 /100 | #306 | Tragic 16.9% |
| Seminole | 0.0 /100 | #307 | Tragic 16.9% |
| Africans | 0.0 /100 | #308 | Tragic 16.9% |
| Immigrants | Mexico | 0.0 /100 | #309 | Tragic 17.0% |
Demographics Similar to Immigrants from Hong Kong by Female Poverty
In terms of female poverty, the demographic groups most similar to Immigrants from Hong Kong are Maltese (11.2%, a difference of 0.11%), Bhutanese (11.3%, a difference of 0.57%), Immigrants from Lithuania (11.3%, a difference of 0.58%), Bulgarian (11.1%, a difference of 0.80%), and Immigrants from South Central Asia (11.1%, a difference of 0.99%).
| Demographics | Rating | Rank | Female Poverty |
| Thais | 100.0 /100 | #3 | Exceptional 10.5% |
| Immigrants | Taiwan | 100.0 /100 | #4 | Exceptional 10.5% |
| Filipinos | 100.0 /100 | #5 | Exceptional 10.9% |
| Immigrants | Ireland | 99.9 /100 | #6 | Exceptional 11.0% |
| Assyrians/Chaldeans/Syriacs | 99.9 /100 | #7 | Exceptional 11.0% |
| Immigrants | South Central Asia | 99.9 /100 | #8 | Exceptional 11.1% |
| Bulgarians | 99.9 /100 | #9 | Exceptional 11.1% |
| Immigrants | Hong Kong | 99.9 /100 | #10 | Exceptional 11.2% |
| Maltese | 99.9 /100 | #11 | Exceptional 11.2% |
| Bhutanese | 99.9 /100 | #12 | Exceptional 11.3% |
| Immigrants | Lithuania | 99.9 /100 | #13 | Exceptional 11.3% |
| Lithuanians | 99.8 /100 | #14 | Exceptional 11.4% |
| Latvians | 99.8 /100 | #15 | Exceptional 11.4% |
| Immigrants | Bolivia | 99.8 /100 | #16 | Exceptional 11.5% |
| Bolivians | 99.8 /100 | #17 | Exceptional 11.5% |