Scottish vs Immigrants from Hong Kong Cognitive Disability
COMPARE
Scottish
Immigrants from Hong Kong
Cognitive Disability
Cognitive Disability Comparison
Scottish
Immigrants from Hong Kong
16.9%
COGNITIVE DISABILITY
95.0/ 100
METRIC RATING
120th/ 347
METRIC RANK
16.0%
COGNITIVE DISABILITY
100.0/ 100
METRIC RATING
5th/ 347
METRIC RANK
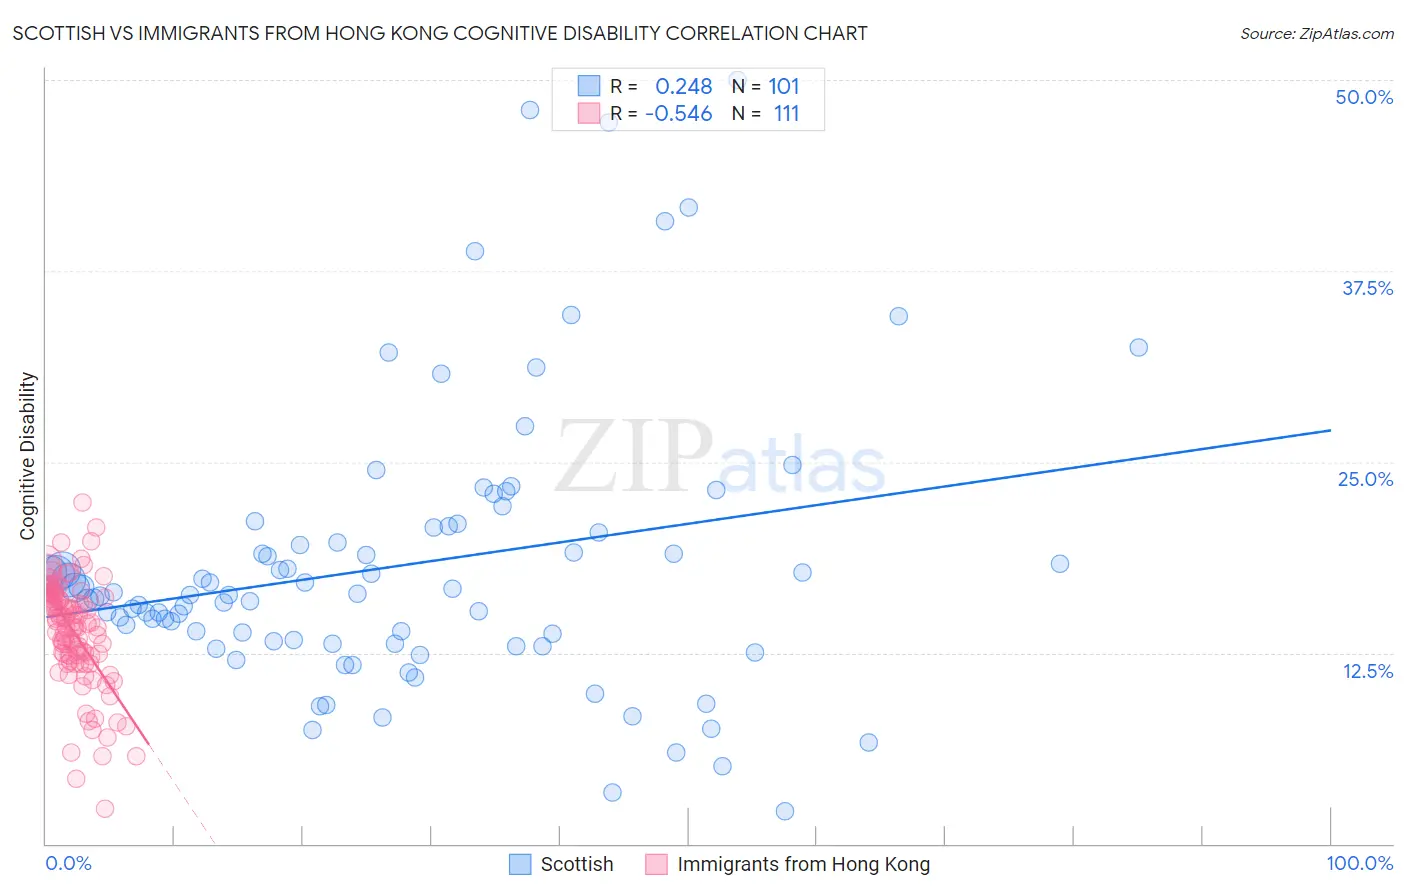
Scottish vs Immigrants from Hong Kong Cognitive Disability Correlation Chart
The statistical analysis conducted on geographies consisting of 566,987,666 people shows a weak positive correlation between the proportion of Scottish and percentage of population with cognitive disability in the United States with a correlation coefficient (R) of 0.248 and weighted average of 16.9%. Similarly, the statistical analysis conducted on geographies consisting of 253,985,578 people shows a substantial negative correlation between the proportion of Immigrants from Hong Kong and percentage of population with cognitive disability in the United States with a correlation coefficient (R) of -0.546 and weighted average of 16.0%, a difference of 5.6%.
Cognitive Disability Correlation Summary
| Measurement | Scottish | Immigrants from Hong Kong |
| Minimum | 2.1% | 2.3% |
| Maximum | 50.0% | 22.3% |
| Range | 47.9% | 20.0% |
| Mean | 18.2% | 13.8% |
| Median | 16.3% | 14.4% |
| Interquartile 25% (IQ1) | 13.2% | 12.2% |
| Interquartile 75% (IQ3) | 20.5% | 16.1% |
| Interquartile Range (IQR) | 7.3% | 3.9% |
| Standard Deviation (Sample) | 9.1% | 3.5% |
| Standard Deviation (Population) | 9.0% | 3.5% |
Similar Demographics by Cognitive Disability
Demographics Similar to Scottish by Cognitive Disability
In terms of cognitive disability, the demographic groups most similar to Scottish are Immigrants from China (16.9%, a difference of 0.020%), Immigrants from Western Europe (16.9%, a difference of 0.030%), Portuguese (16.9%, a difference of 0.040%), Turkish (16.9%, a difference of 0.070%), and South African (16.9%, a difference of 0.080%).
| Demographics | Rating | Rank | Cognitive Disability |
| Immigrants | Sri Lanka | 97.1 /100 | #113 | Exceptional 16.8% |
| Koreans | 97.1 /100 | #114 | Exceptional 16.8% |
| Yup'ik | 96.9 /100 | #115 | Exceptional 16.9% |
| Inupiat | 96.5 /100 | #116 | Exceptional 16.9% |
| Immigrants | Japan | 96.2 /100 | #117 | Exceptional 16.9% |
| Immigrants | Denmark | 96.2 /100 | #118 | Exceptional 16.9% |
| South Africans | 95.5 /100 | #119 | Exceptional 16.9% |
| Scottish | 95.0 /100 | #120 | Exceptional 16.9% |
| Immigrants | China | 94.9 /100 | #121 | Exceptional 16.9% |
| Immigrants | Western Europe | 94.8 /100 | #122 | Exceptional 16.9% |
| Portuguese | 94.7 /100 | #123 | Exceptional 16.9% |
| Turks | 94.5 /100 | #124 | Exceptional 16.9% |
| Scandinavians | 94.1 /100 | #125 | Exceptional 16.9% |
| Europeans | 93.4 /100 | #126 | Exceptional 17.0% |
| Immigrants | Costa Rica | 93.1 /100 | #127 | Exceptional 17.0% |
Demographics Similar to Immigrants from Hong Kong by Cognitive Disability
In terms of cognitive disability, the demographic groups most similar to Immigrants from Hong Kong are Immigrants from Lithuania (16.0%, a difference of 0.41%), Chinese (15.9%, a difference of 0.59%), Thai (16.1%, a difference of 0.61%), Immigrants from India (15.9%, a difference of 0.68%), and Immigrants from Ireland (16.1%, a difference of 0.72%).
| Demographics | Rating | Rank | Cognitive Disability |
| Immigrants | Taiwan | 100.0 /100 | #1 | Exceptional 15.7% |
| Immigrants | India | 100.0 /100 | #2 | Exceptional 15.9% |
| Chinese | 100.0 /100 | #3 | Exceptional 15.9% |
| Immigrants | Lithuania | 100.0 /100 | #4 | Exceptional 16.0% |
| Immigrants | Hong Kong | 100.0 /100 | #5 | Exceptional 16.0% |
| Thais | 100.0 /100 | #6 | Exceptional 16.1% |
| Immigrants | Ireland | 100.0 /100 | #7 | Exceptional 16.1% |
| Immigrants | Poland | 100.0 /100 | #8 | Exceptional 16.1% |
| Assyrians/Chaldeans/Syriacs | 100.0 /100 | #9 | Exceptional 16.2% |
| Immigrants | Scotland | 100.0 /100 | #10 | Exceptional 16.2% |
| Immigrants | Czechoslovakia | 100.0 /100 | #11 | Exceptional 16.2% |
| Maltese | 100.0 /100 | #12 | Exceptional 16.2% |
| Lithuanians | 100.0 /100 | #13 | Exceptional 16.3% |
| Immigrants | Austria | 100.0 /100 | #14 | Exceptional 16.3% |
| Immigrants | Greece | 100.0 /100 | #15 | Exceptional 16.3% |