Guyanese vs Immigrants from Hong Kong Family Poverty
COMPARE
Guyanese
Immigrants from Hong Kong
Family Poverty
Family Poverty Comparison
Guyanese
Immigrants from Hong Kong
11.2%
FAMILY POVERTY
0.1/ 100
METRIC RATING
278th/ 347
METRIC RANK
7.3%
FAMILY POVERTY
99.7/ 100
METRIC RATING
20th/ 347
METRIC RANK
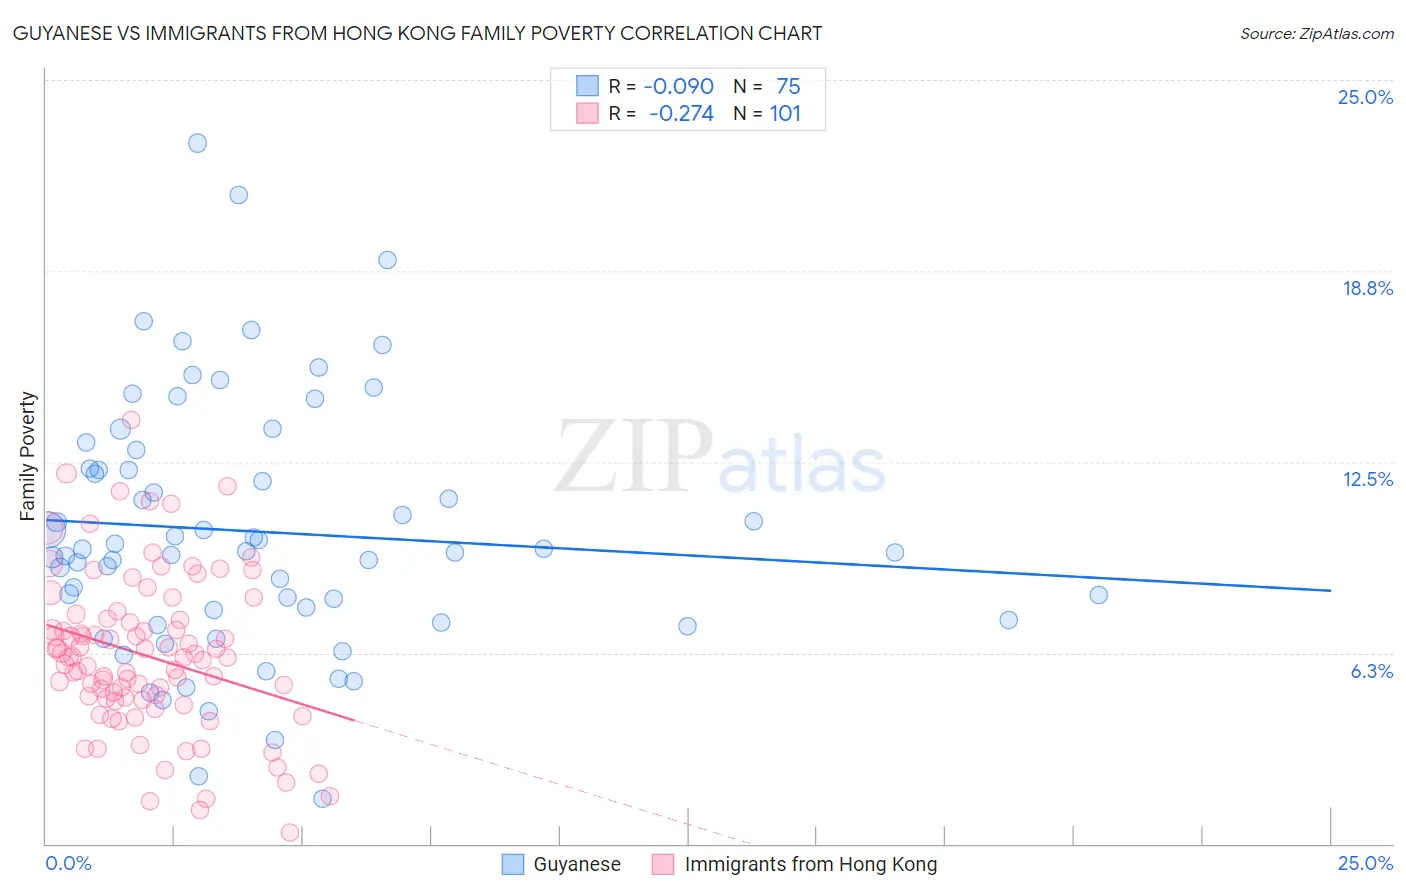
Guyanese vs Immigrants from Hong Kong Family Poverty Correlation Chart
The statistical analysis conducted on geographies consisting of 176,578,475 people shows a slight negative correlation between the proportion of Guyanese and poverty level among families in the United States with a correlation coefficient (R) of -0.090 and weighted average of 11.2%. Similarly, the statistical analysis conducted on geographies consisting of 253,546,628 people shows a weak negative correlation between the proportion of Immigrants from Hong Kong and poverty level among families in the United States with a correlation coefficient (R) of -0.274 and weighted average of 7.3%, a difference of 55.0%.
Family Poverty Correlation Summary
| Measurement | Guyanese | Immigrants from Hong Kong |
| Minimum | 1.5% | 0.35% |
| Maximum | 22.9% | 13.9% |
| Range | 21.5% | 13.5% |
| Mean | 10.2% | 6.2% |
| Median | 9.6% | 6.1% |
| Interquartile 25% (IQ1) | 7.3% | 4.7% |
| Interquartile 75% (IQ3) | 12.3% | 7.4% |
| Interquartile Range (IQR) | 4.9% | 2.6% |
| Standard Deviation (Sample) | 4.2% | 2.6% |
| Standard Deviation (Population) | 4.1% | 2.5% |
Similar Demographics by Family Poverty
Demographics Similar to Guyanese by Family Poverty
In terms of family poverty, the demographic groups most similar to Guyanese are Chippewa (11.2%, a difference of 0.030%), Immigrants from Guyana (11.2%, a difference of 0.12%), Central American (11.2%, a difference of 0.14%), Blackfeet (11.3%, a difference of 0.14%), and Belizean (11.3%, a difference of 0.18%).
| Demographics | Rating | Rank | Family Poverty |
| Immigrants | Bahamas | 0.1 /100 | #271 | Tragic 11.1% |
| Immigrants | Jamaica | 0.1 /100 | #272 | Tragic 11.2% |
| Somalis | 0.1 /100 | #273 | Tragic 11.2% |
| Spanish Americans | 0.1 /100 | #274 | Tragic 11.2% |
| Central Americans | 0.1 /100 | #275 | Tragic 11.2% |
| Immigrants | Guyana | 0.1 /100 | #276 | Tragic 11.2% |
| Chippewa | 0.1 /100 | #277 | Tragic 11.2% |
| Guyanese | 0.1 /100 | #278 | Tragic 11.2% |
| Blackfeet | 0.0 /100 | #279 | Tragic 11.3% |
| Belizeans | 0.0 /100 | #280 | Tragic 11.3% |
| Immigrants | West Indies | 0.0 /100 | #281 | Tragic 11.3% |
| Immigrants | Cuba | 0.0 /100 | #282 | Tragic 11.3% |
| Indonesians | 0.0 /100 | #283 | Tragic 11.3% |
| Yaqui | 0.0 /100 | #284 | Tragic 11.3% |
| Barbadians | 0.0 /100 | #285 | Tragic 11.3% |
Demographics Similar to Immigrants from Hong Kong by Family Poverty
In terms of family poverty, the demographic groups most similar to Immigrants from Hong Kong are Eastern European (7.2%, a difference of 0.16%), Immigrants from Iran (7.3%, a difference of 0.20%), Immigrants from Lithuania (7.2%, a difference of 0.46%), Luxembourger (7.2%, a difference of 0.48%), and Danish (7.3%, a difference of 0.64%).
| Demographics | Rating | Rank | Family Poverty |
| Swedes | 99.8 /100 | #13 | Exceptional 7.1% |
| Iranians | 99.8 /100 | #14 | Exceptional 7.1% |
| Lithuanians | 99.8 /100 | #15 | Exceptional 7.2% |
| Immigrants | South Central Asia | 99.8 /100 | #16 | Exceptional 7.2% |
| Luxembourgers | 99.8 /100 | #17 | Exceptional 7.2% |
| Immigrants | Lithuania | 99.8 /100 | #18 | Exceptional 7.2% |
| Eastern Europeans | 99.7 /100 | #19 | Exceptional 7.2% |
| Immigrants | Hong Kong | 99.7 /100 | #20 | Exceptional 7.3% |
| Immigrants | Iran | 99.7 /100 | #21 | Exceptional 7.3% |
| Danes | 99.7 /100 | #22 | Exceptional 7.3% |
| Assyrians/Chaldeans/Syriacs | 99.7 /100 | #23 | Exceptional 7.3% |
| Croatians | 99.7 /100 | #24 | Exceptional 7.3% |
| Burmese | 99.7 /100 | #25 | Exceptional 7.3% |
| Cypriots | 99.6 /100 | #26 | Exceptional 7.3% |
| Immigrants | Scotland | 99.6 /100 | #27 | Exceptional 7.3% |