Afghan vs Immigrants from Hong Kong Family Poverty
COMPARE
Afghan
Immigrants from Hong Kong
Family Poverty
Family Poverty Comparison
Afghans
Immigrants from Hong Kong
8.8%
FAMILY POVERTY
63.5/ 100
METRIC RATING
166th/ 347
METRIC RANK
7.3%
FAMILY POVERTY
99.7/ 100
METRIC RATING
20th/ 347
METRIC RANK
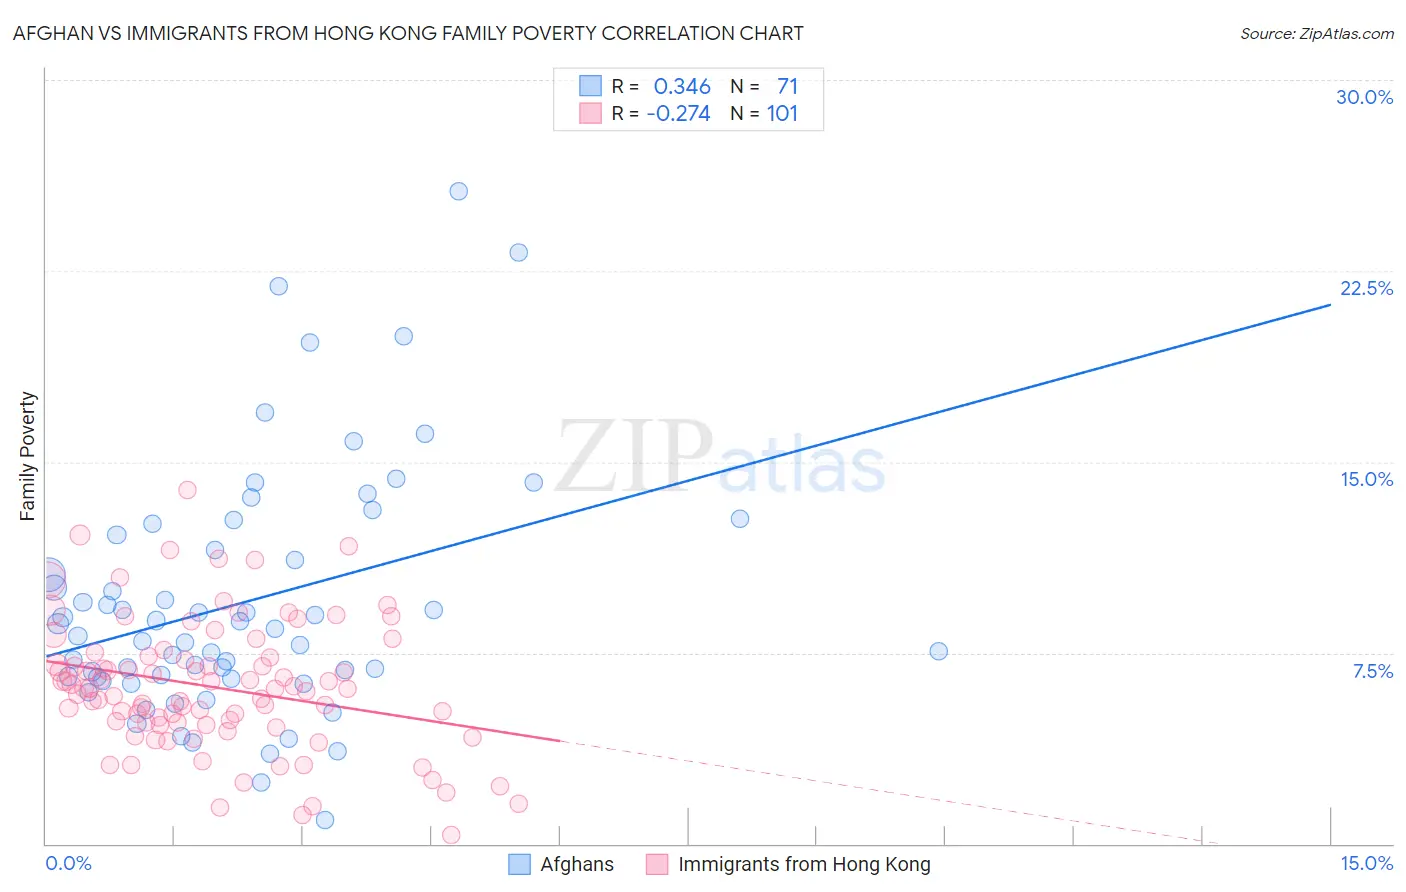
Afghan vs Immigrants from Hong Kong Family Poverty Correlation Chart
The statistical analysis conducted on geographies consisting of 148,686,157 people shows a mild positive correlation between the proportion of Afghans and poverty level among families in the United States with a correlation coefficient (R) of 0.346 and weighted average of 8.8%. Similarly, the statistical analysis conducted on geographies consisting of 253,546,628 people shows a weak negative correlation between the proportion of Immigrants from Hong Kong and poverty level among families in the United States with a correlation coefficient (R) of -0.274 and weighted average of 7.3%, a difference of 21.9%.
Family Poverty Correlation Summary
| Measurement | Afghan | Immigrants from Hong Kong |
| Minimum | 0.91% | 0.35% |
| Maximum | 25.6% | 13.9% |
| Range | 24.7% | 13.5% |
| Mean | 9.5% | 6.2% |
| Median | 8.4% | 6.1% |
| Interquartile 25% (IQ1) | 6.5% | 4.7% |
| Interquartile 75% (IQ3) | 12.1% | 7.4% |
| Interquartile Range (IQR) | 5.6% | 2.6% |
| Standard Deviation (Sample) | 4.8% | 2.6% |
| Standard Deviation (Population) | 4.8% | 2.5% |
Similar Demographics by Family Poverty
Demographics Similar to Afghans by Family Poverty
In terms of family poverty, the demographic groups most similar to Afghans are Immigrants from Ethiopia (8.9%, a difference of 0.14%), Guamanian/Chamorro (8.8%, a difference of 0.18%), Israeli (8.9%, a difference of 0.20%), Celtic (8.8%, a difference of 0.21%), and Pennsylvania German (8.8%, a difference of 0.37%).
| Demographics | Rating | Rank | Family Poverty |
| Peruvians | 68.0 /100 | #159 | Good 8.8% |
| Hungarians | 67.2 /100 | #160 | Good 8.8% |
| Immigrants | Northern Africa | 66.9 /100 | #161 | Good 8.8% |
| Ethiopians | 66.3 /100 | #162 | Good 8.8% |
| Pennsylvania Germans | 66.0 /100 | #163 | Good 8.8% |
| Celtics | 64.9 /100 | #164 | Good 8.8% |
| Guamanians/Chamorros | 64.7 /100 | #165 | Good 8.8% |
| Afghans | 63.5 /100 | #166 | Good 8.8% |
| Immigrants | Ethiopia | 62.5 /100 | #167 | Good 8.9% |
| Israelis | 62.1 /100 | #168 | Good 8.9% |
| Immigrants | Chile | 59.6 /100 | #169 | Average 8.9% |
| Kenyans | 58.2 /100 | #170 | Average 8.9% |
| Lebanese | 57.6 /100 | #171 | Average 8.9% |
| Immigrants | Peru | 57.5 /100 | #172 | Average 8.9% |
| Immigrants | Fiji | 56.4 /100 | #173 | Average 8.9% |
Demographics Similar to Immigrants from Hong Kong by Family Poverty
In terms of family poverty, the demographic groups most similar to Immigrants from Hong Kong are Eastern European (7.2%, a difference of 0.16%), Immigrants from Iran (7.3%, a difference of 0.20%), Immigrants from Lithuania (7.2%, a difference of 0.46%), Luxembourger (7.2%, a difference of 0.48%), and Danish (7.3%, a difference of 0.64%).
| Demographics | Rating | Rank | Family Poverty |
| Swedes | 99.8 /100 | #13 | Exceptional 7.1% |
| Iranians | 99.8 /100 | #14 | Exceptional 7.1% |
| Lithuanians | 99.8 /100 | #15 | Exceptional 7.2% |
| Immigrants | South Central Asia | 99.8 /100 | #16 | Exceptional 7.2% |
| Luxembourgers | 99.8 /100 | #17 | Exceptional 7.2% |
| Immigrants | Lithuania | 99.8 /100 | #18 | Exceptional 7.2% |
| Eastern Europeans | 99.7 /100 | #19 | Exceptional 7.2% |
| Immigrants | Hong Kong | 99.7 /100 | #20 | Exceptional 7.3% |
| Immigrants | Iran | 99.7 /100 | #21 | Exceptional 7.3% |
| Danes | 99.7 /100 | #22 | Exceptional 7.3% |
| Assyrians/Chaldeans/Syriacs | 99.7 /100 | #23 | Exceptional 7.3% |
| Croatians | 99.7 /100 | #24 | Exceptional 7.3% |
| Burmese | 99.7 /100 | #25 | Exceptional 7.3% |
| Cypriots | 99.6 /100 | #26 | Exceptional 7.3% |
| Immigrants | Scotland | 99.6 /100 | #27 | Exceptional 7.3% |