Menominee vs Immigrants from Hong Kong Family Poverty
COMPARE
Menominee
Immigrants from Hong Kong
Family Poverty
Family Poverty Comparison
Menominee
Immigrants from Hong Kong
12.7%
FAMILY POVERTY
0.0/ 100
METRIC RATING
323rd/ 347
METRIC RANK
7.3%
FAMILY POVERTY
99.7/ 100
METRIC RATING
20th/ 347
METRIC RANK
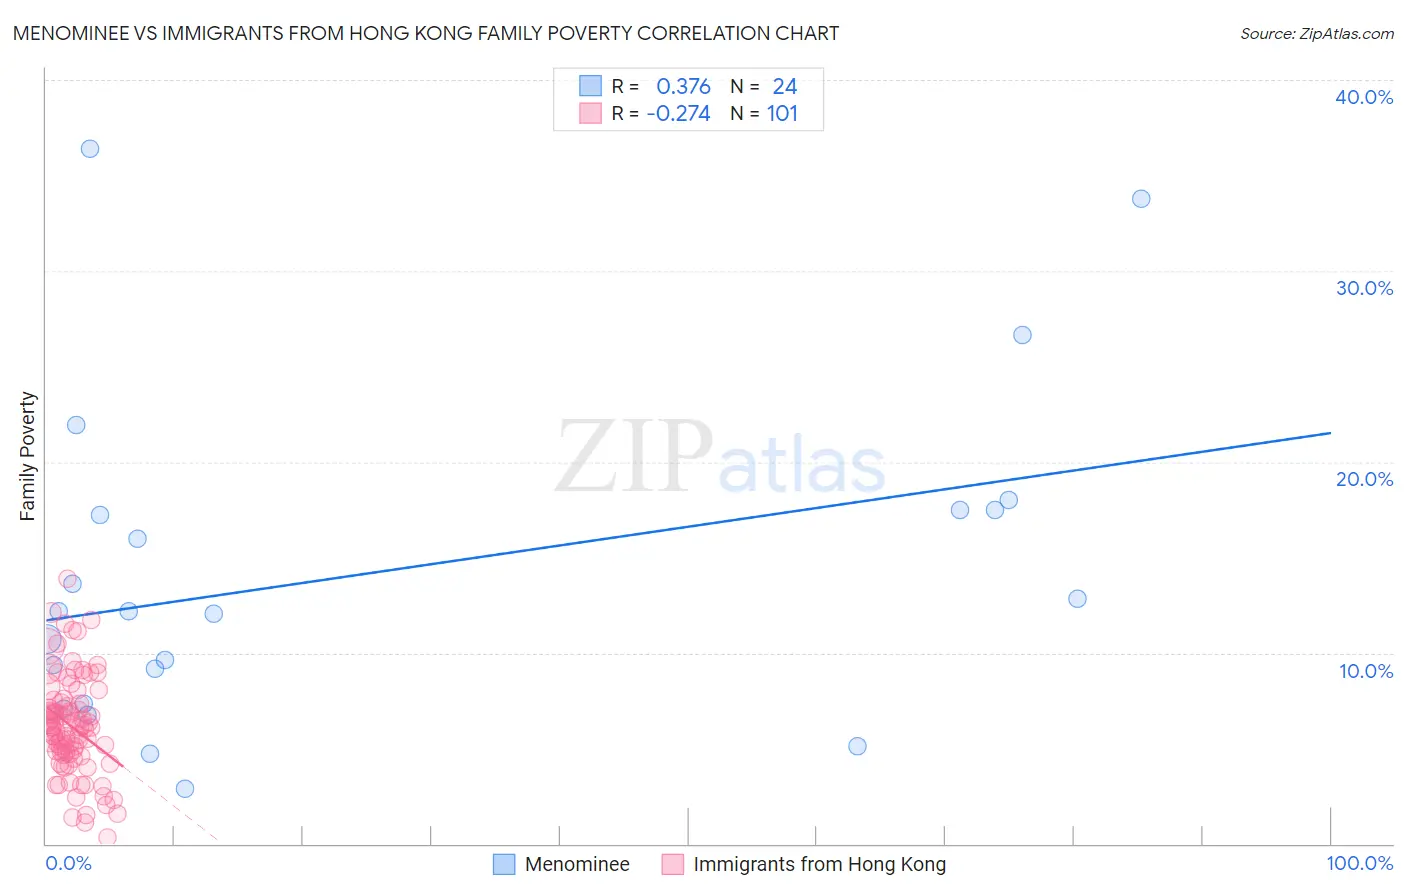
Menominee vs Immigrants from Hong Kong Family Poverty Correlation Chart
The statistical analysis conducted on geographies consisting of 45,766,702 people shows a mild positive correlation between the proportion of Menominee and poverty level among families in the United States with a correlation coefficient (R) of 0.376 and weighted average of 12.7%. Similarly, the statistical analysis conducted on geographies consisting of 253,546,628 people shows a weak negative correlation between the proportion of Immigrants from Hong Kong and poverty level among families in the United States with a correlation coefficient (R) of -0.274 and weighted average of 7.3%, a difference of 75.5%.
Family Poverty Correlation Summary
| Measurement | Menominee | Immigrants from Hong Kong |
| Minimum | 2.9% | 0.35% |
| Maximum | 36.4% | 13.9% |
| Range | 33.5% | 13.5% |
| Mean | 14.2% | 6.2% |
| Median | 12.2% | 6.1% |
| Interquartile 25% (IQ1) | 8.2% | 4.7% |
| Interquartile 75% (IQ3) | 17.5% | 7.4% |
| Interquartile Range (IQR) | 9.3% | 2.6% |
| Standard Deviation (Sample) | 8.6% | 2.6% |
| Standard Deviation (Population) | 8.4% | 2.5% |
Similar Demographics by Family Poverty
Demographics Similar to Menominee by Family Poverty
In terms of family poverty, the demographic groups most similar to Menominee are Immigrants from Dominica (12.7%, a difference of 0.080%), Immigrants from Honduras (12.7%, a difference of 0.54%), Arapaho (12.7%, a difference of 0.65%), Paiute (13.0%, a difference of 2.0%), and Colville (13.0%, a difference of 2.1%).
| Demographics | Rating | Rank | Family Poverty |
| Hondurans | 0.0 /100 | #316 | Tragic 12.4% |
| Immigrants | Grenada | 0.0 /100 | #317 | Tragic 12.4% |
| U.S. Virgin Islanders | 0.0 /100 | #318 | Tragic 12.4% |
| British West Indians | 0.0 /100 | #319 | Tragic 12.4% |
| Inupiat | 0.0 /100 | #320 | Tragic 12.5% |
| Arapaho | 0.0 /100 | #321 | Tragic 12.7% |
| Immigrants | Honduras | 0.0 /100 | #322 | Tragic 12.7% |
| Menominee | 0.0 /100 | #323 | Tragic 12.7% |
| Immigrants | Dominica | 0.0 /100 | #324 | Tragic 12.7% |
| Paiute | 0.0 /100 | #325 | Tragic 13.0% |
| Colville | 0.0 /100 | #326 | Tragic 13.0% |
| Yakama | 0.0 /100 | #327 | Tragic 13.1% |
| Central American Indians | 0.0 /100 | #328 | Tragic 13.3% |
| Blacks/African Americans | 0.0 /100 | #329 | Tragic 13.3% |
| Natives/Alaskans | 0.0 /100 | #330 | Tragic 14.3% |
Demographics Similar to Immigrants from Hong Kong by Family Poverty
In terms of family poverty, the demographic groups most similar to Immigrants from Hong Kong are Eastern European (7.2%, a difference of 0.16%), Immigrants from Iran (7.3%, a difference of 0.20%), Immigrants from Lithuania (7.2%, a difference of 0.46%), Luxembourger (7.2%, a difference of 0.48%), and Danish (7.3%, a difference of 0.64%).
| Demographics | Rating | Rank | Family Poverty |
| Swedes | 99.8 /100 | #13 | Exceptional 7.1% |
| Iranians | 99.8 /100 | #14 | Exceptional 7.1% |
| Lithuanians | 99.8 /100 | #15 | Exceptional 7.2% |
| Immigrants | South Central Asia | 99.8 /100 | #16 | Exceptional 7.2% |
| Luxembourgers | 99.8 /100 | #17 | Exceptional 7.2% |
| Immigrants | Lithuania | 99.8 /100 | #18 | Exceptional 7.2% |
| Eastern Europeans | 99.7 /100 | #19 | Exceptional 7.2% |
| Immigrants | Hong Kong | 99.7 /100 | #20 | Exceptional 7.3% |
| Immigrants | Iran | 99.7 /100 | #21 | Exceptional 7.3% |
| Danes | 99.7 /100 | #22 | Exceptional 7.3% |
| Assyrians/Chaldeans/Syriacs | 99.7 /100 | #23 | Exceptional 7.3% |
| Croatians | 99.7 /100 | #24 | Exceptional 7.3% |
| Burmese | 99.7 /100 | #25 | Exceptional 7.3% |
| Cypriots | 99.6 /100 | #26 | Exceptional 7.3% |
| Immigrants | Scotland | 99.6 /100 | #27 | Exceptional 7.3% |