Samoan vs Potawatomi Disability Age Over 75
COMPARE
Samoan
Potawatomi
Disability Age Over 75
Disability Age Over 75 Comparison
Samoans
Potawatomi
49.5%
DISABILITY AGE OVER 75
0.0/ 100
METRIC RATING
283rd/ 347
METRIC RANK
49.0%
DISABILITY AGE OVER 75
0.2/ 100
METRIC RATING
270th/ 347
METRIC RANK
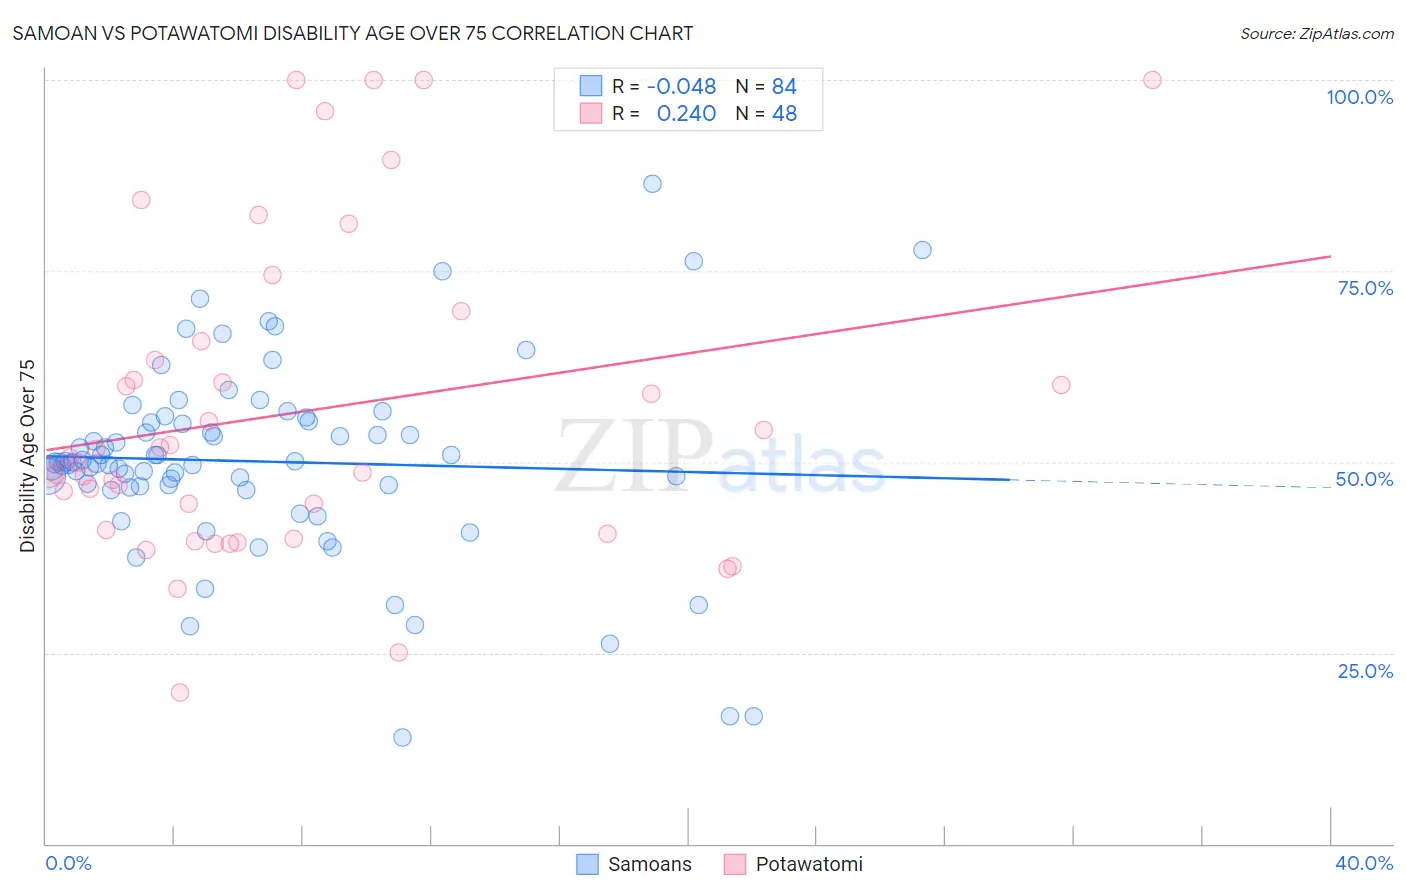
Samoan vs Potawatomi Disability Age Over 75 Correlation Chart
The statistical analysis conducted on geographies consisting of 224,696,097 people shows no correlation between the proportion of Samoans and percentage of population with a disability over the age of 75 in the United States with a correlation coefficient (R) of -0.048 and weighted average of 49.5%. Similarly, the statistical analysis conducted on geographies consisting of 117,704,790 people shows a weak positive correlation between the proportion of Potawatomi and percentage of population with a disability over the age of 75 in the United States with a correlation coefficient (R) of 0.240 and weighted average of 49.0%, a difference of 0.97%.
Disability Age Over 75 Correlation Summary
| Measurement | Samoan | Potawatomi |
| Minimum | 14.0% | 19.8% |
| Maximum | 86.4% | 100.0% |
| Range | 72.4% | 80.2% |
| Mean | 50.1% | 56.5% |
| Median | 49.9% | 50.3% |
| Interquartile 25% (IQ1) | 46.7% | 40.8% |
| Interquartile 75% (IQ3) | 55.2% | 64.6% |
| Interquartile Range (IQR) | 8.4% | 23.8% |
| Standard Deviation (Sample) | 12.6% | 20.6% |
| Standard Deviation (Population) | 12.5% | 20.4% |
Demographics Similar to Samoans and Potawatomi by Disability Age Over 75
In terms of disability age over 75, the demographic groups most similar to Samoans are Black/African American (49.5%, a difference of 0.030%), Immigrants from Latin America (49.5%, a difference of 0.050%), Bangladeshi (49.4%, a difference of 0.17%), Belizean (49.4%, a difference of 0.17%), and Crow (49.6%, a difference of 0.19%). Similarly, the demographic groups most similar to Potawatomi are Fijian (49.0%, a difference of 0.020%), Immigrants from El Salvador (49.0%, a difference of 0.030%), Assyrian/Chaldean/Syriac (49.1%, a difference of 0.030%), Guatemalan (49.0%, a difference of 0.050%), and Malaysian (49.0%, a difference of 0.060%).
| Demographics | Rating | Rank | Disability Age Over 75 |
| U.S. Virgin Islanders | 0.2 /100 | #266 | Tragic 48.9% |
| Malaysians | 0.2 /100 | #267 | Tragic 49.0% |
| Guatemalans | 0.2 /100 | #268 | Tragic 49.0% |
| Immigrants | El Salvador | 0.2 /100 | #269 | Tragic 49.0% |
| Potawatomi | 0.2 /100 | #270 | Tragic 49.0% |
| Fijians | 0.2 /100 | #271 | Tragic 49.0% |
| Assyrians/Chaldeans/Syriacs | 0.2 /100 | #272 | Tragic 49.1% |
| Immigrants | Iraq | 0.1 /100 | #273 | Tragic 49.1% |
| Immigrants | Guatemala | 0.1 /100 | #274 | Tragic 49.1% |
| Immigrants | Dominica | 0.1 /100 | #275 | Tragic 49.1% |
| Immigrants | Uzbekistan | 0.1 /100 | #276 | Tragic 49.2% |
| Hawaiians | 0.1 /100 | #277 | Tragic 49.2% |
| Immigrants | Laos | 0.1 /100 | #278 | Tragic 49.2% |
| Guamanians/Chamorros | 0.0 /100 | #279 | Tragic 49.4% |
| Bangladeshis | 0.0 /100 | #280 | Tragic 49.4% |
| Belizeans | 0.0 /100 | #281 | Tragic 49.4% |
| Blacks/African Americans | 0.0 /100 | #282 | Tragic 49.5% |
| Samoans | 0.0 /100 | #283 | Tragic 49.5% |
| Immigrants | Latin America | 0.0 /100 | #284 | Tragic 49.5% |
| Crow | 0.0 /100 | #285 | Tragic 49.6% |
| Immigrants | Belize | 0.0 /100 | #286 | Tragic 49.6% |