Salvadoran vs Immigrants from Korea Female Poverty
COMPARE
Salvadoran
Immigrants from Korea
Female Poverty
Female Poverty Comparison
Salvadorans
Immigrants from Korea
15.3%
FEMALE POVERTY
0.3/ 100
METRIC RATING
249th/ 347
METRIC RANK
11.7%
FEMALE POVERTY
99.6/ 100
METRIC RATING
28th/ 347
METRIC RANK
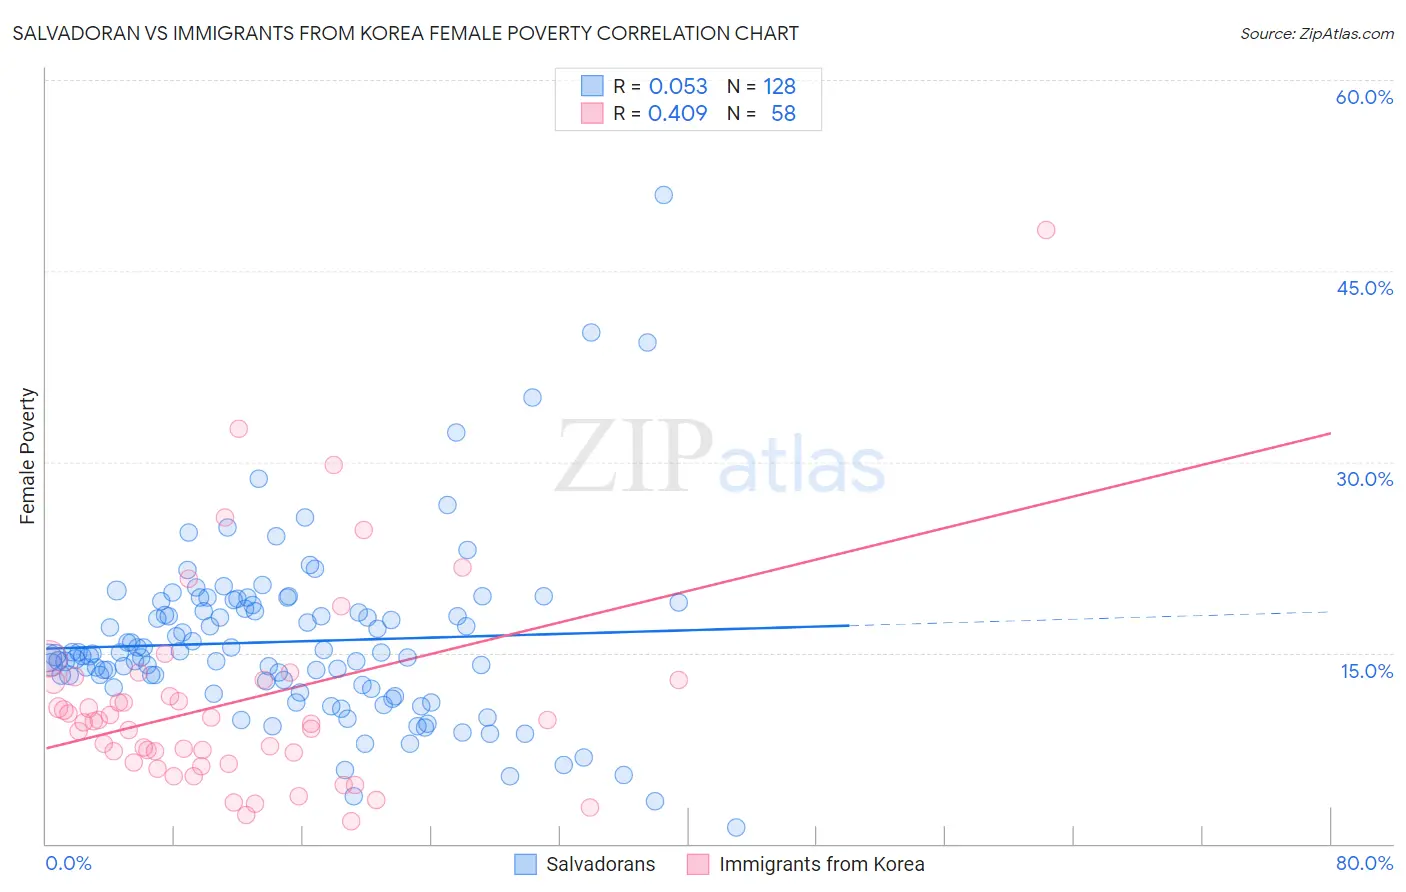
Salvadoran vs Immigrants from Korea Female Poverty Correlation Chart
The statistical analysis conducted on geographies consisting of 398,655,447 people shows a slight positive correlation between the proportion of Salvadorans and poverty level among females in the United States with a correlation coefficient (R) of 0.053 and weighted average of 15.3%. Similarly, the statistical analysis conducted on geographies consisting of 415,882,145 people shows a moderate positive correlation between the proportion of Immigrants from Korea and poverty level among females in the United States with a correlation coefficient (R) of 0.409 and weighted average of 11.7%, a difference of 31.3%.
Female Poverty Correlation Summary
| Measurement | Salvadoran | Immigrants from Korea |
| Minimum | 1.3% | 1.7% |
| Maximum | 50.9% | 48.2% |
| Range | 49.7% | 46.5% |
| Mean | 15.9% | 11.1% |
| Median | 14.9% | 9.6% |
| Interquartile 25% (IQ1) | 12.3% | 6.4% |
| Interquartile 75% (IQ3) | 18.6% | 12.8% |
| Interquartile Range (IQR) | 6.3% | 6.5% |
| Standard Deviation (Sample) | 6.9% | 8.1% |
| Standard Deviation (Population) | 6.9% | 8.1% |
Similar Demographics by Female Poverty
Demographics Similar to Salvadorans by Female Poverty
In terms of female poverty, the demographic groups most similar to Salvadorans are Immigrants from Western Africa (15.3%, a difference of 0.040%), Potawatomi (15.3%, a difference of 0.14%), Immigrants from Ghana (15.3%, a difference of 0.14%), Cuban (15.3%, a difference of 0.15%), and Spanish American Indian (15.3%, a difference of 0.20%).
| Demographics | Rating | Rank | Female Poverty |
| Nepalese | 0.4 /100 | #242 | Tragic 15.2% |
| Nicaraguans | 0.3 /100 | #243 | Tragic 15.3% |
| Ecuadorians | 0.3 /100 | #244 | Tragic 15.3% |
| Spanish American Indians | 0.3 /100 | #245 | Tragic 15.3% |
| Cubans | 0.3 /100 | #246 | Tragic 15.3% |
| Potawatomi | 0.3 /100 | #247 | Tragic 15.3% |
| Immigrants | Ghana | 0.3 /100 | #248 | Tragic 15.3% |
| Salvadorans | 0.3 /100 | #249 | Tragic 15.3% |
| Immigrants | Western Africa | 0.3 /100 | #250 | Tragic 15.3% |
| Immigrants | Trinidad and Tobago | 0.3 /100 | #251 | Tragic 15.4% |
| Immigrants | Burma/Myanmar | 0.3 /100 | #252 | Tragic 15.4% |
| Liberians | 0.2 /100 | #253 | Tragic 15.4% |
| Trinidadians and Tobagonians | 0.2 /100 | #254 | Tragic 15.4% |
| Ottawa | 0.2 /100 | #255 | Tragic 15.5% |
| Jamaicans | 0.2 /100 | #256 | Tragic 15.5% |
Demographics Similar to Immigrants from Korea by Female Poverty
In terms of female poverty, the demographic groups most similar to Immigrants from Korea are Immigrants from North Macedonia (11.7%, a difference of 0.15%), Iranian (11.7%, a difference of 0.21%), Greek (11.7%, a difference of 0.23%), Immigrants from Northern Europe (11.6%, a difference of 0.32%), and Croatian (11.6%, a difference of 0.32%).
| Demographics | Rating | Rank | Female Poverty |
| Italians | 99.7 /100 | #21 | Exceptional 11.6% |
| Swedes | 99.7 /100 | #22 | Exceptional 11.6% |
| Burmese | 99.7 /100 | #23 | Exceptional 11.6% |
| Luxembourgers | 99.7 /100 | #24 | Exceptional 11.6% |
| Immigrants | Northern Europe | 99.6 /100 | #25 | Exceptional 11.6% |
| Croatians | 99.6 /100 | #26 | Exceptional 11.6% |
| Iranians | 99.6 /100 | #27 | Exceptional 11.7% |
| Immigrants | Korea | 99.6 /100 | #28 | Exceptional 11.7% |
| Immigrants | North Macedonia | 99.6 /100 | #29 | Exceptional 11.7% |
| Greeks | 99.5 /100 | #30 | Exceptional 11.7% |
| Poles | 99.5 /100 | #31 | Exceptional 11.7% |
| Danes | 99.5 /100 | #32 | Exceptional 11.7% |
| Cypriots | 99.5 /100 | #33 | Exceptional 11.8% |
| Immigrants | Singapore | 99.4 /100 | #34 | Exceptional 11.8% |
| Immigrants | Iran | 99.4 /100 | #35 | Exceptional 11.8% |