Celtic vs Immigrants from Eritrea Female Poverty
COMPARE
Celtic
Immigrants from Eritrea
Female Poverty
Female Poverty Comparison
Celtics
Immigrants from Eritrea
13.4%
FEMALE POVERTY
49.9/ 100
METRIC RATING
175th/ 347
METRIC RANK
14.6%
FEMALE POVERTY
2.4/ 100
METRIC RATING
226th/ 347
METRIC RANK
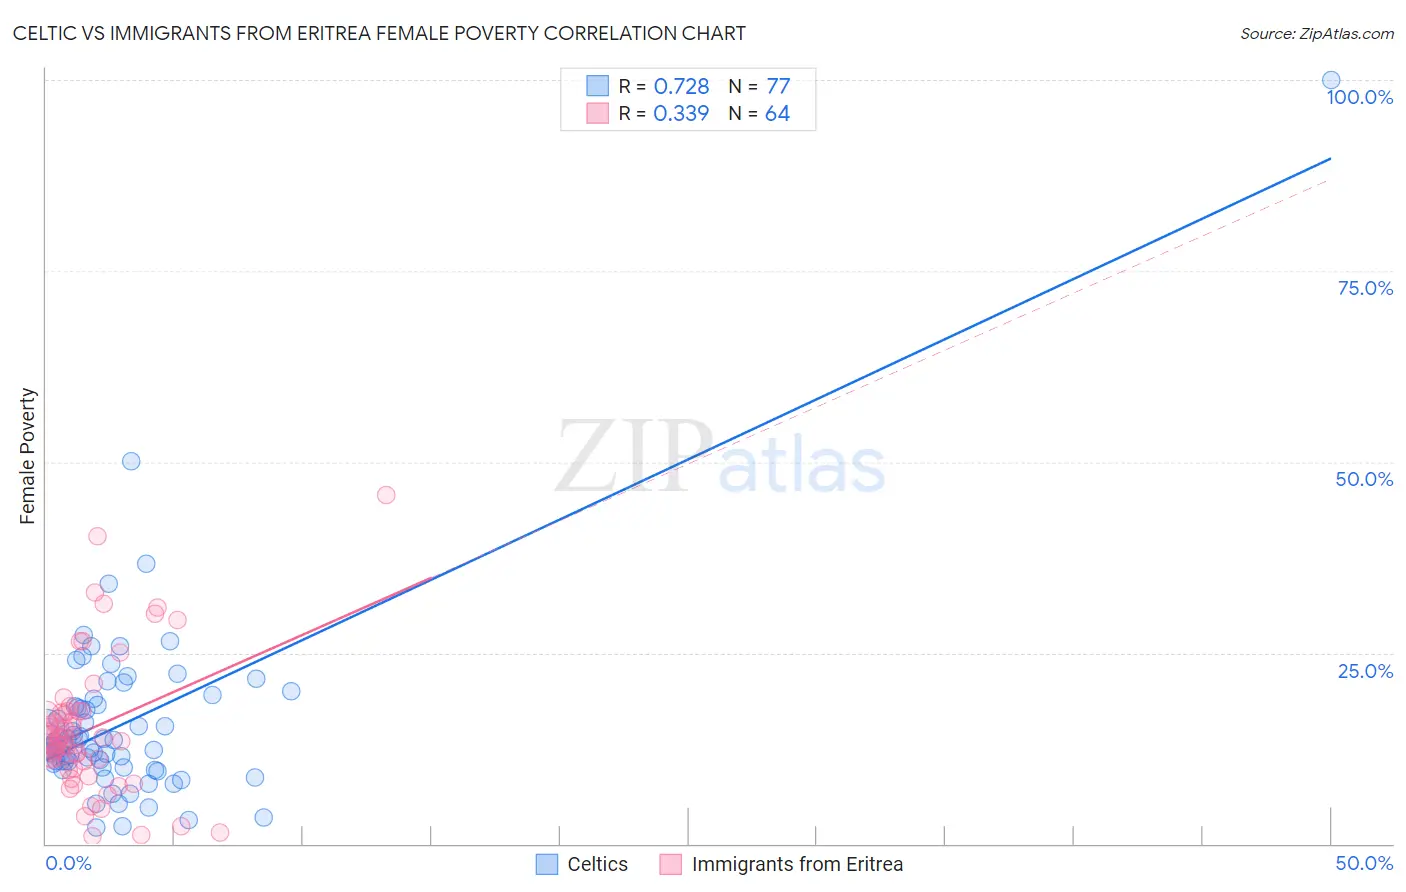
Celtic vs Immigrants from Eritrea Female Poverty Correlation Chart
The statistical analysis conducted on geographies consisting of 168,846,795 people shows a strong positive correlation between the proportion of Celtics and poverty level among females in the United States with a correlation coefficient (R) of 0.728 and weighted average of 13.4%. Similarly, the statistical analysis conducted on geographies consisting of 104,846,826 people shows a mild positive correlation between the proportion of Immigrants from Eritrea and poverty level among females in the United States with a correlation coefficient (R) of 0.339 and weighted average of 14.6%, a difference of 8.9%.
Female Poverty Correlation Summary
| Measurement | Celtic | Immigrants from Eritrea |
| Minimum | 2.2% | 1.0% |
| Maximum | 100.0% | 45.6% |
| Range | 97.8% | 44.6% |
| Mean | 15.9% | 15.0% |
| Median | 12.9% | 13.6% |
| Interquartile 25% (IQ1) | 10.3% | 10.3% |
| Interquartile 75% (IQ3) | 18.6% | 17.2% |
| Interquartile Range (IQR) | 8.3% | 6.9% |
| Standard Deviation (Sample) | 12.5% | 8.9% |
| Standard Deviation (Population) | 12.5% | 8.8% |
Similar Demographics by Female Poverty
Demographics Similar to Celtics by Female Poverty
In terms of female poverty, the demographic groups most similar to Celtics are Immigrants from Spain (13.4%, a difference of 0.0%), Immigrants from Iraq (13.4%, a difference of 0.010%), Immigrants from Morocco (13.4%, a difference of 0.050%), Immigrants from Afghanistan (13.4%, a difference of 0.080%), and Israeli (13.5%, a difference of 0.080%).
| Demographics | Rating | Rank | Female Poverty |
| Aleuts | 56.7 /100 | #168 | Average 13.4% |
| Lebanese | 55.9 /100 | #169 | Average 13.4% |
| Colombians | 55.7 /100 | #170 | Average 13.4% |
| Whites/Caucasians | 54.6 /100 | #171 | Average 13.4% |
| Mongolians | 53.6 /100 | #172 | Average 13.4% |
| Immigrants | Afghanistan | 50.8 /100 | #173 | Average 13.4% |
| Immigrants | Iraq | 50.0 /100 | #174 | Average 13.4% |
| Celtics | 49.9 /100 | #175 | Average 13.4% |
| Immigrants | Spain | 49.9 /100 | #176 | Average 13.4% |
| Immigrants | Morocco | 49.4 /100 | #177 | Average 13.4% |
| Israelis | 49.1 /100 | #178 | Average 13.5% |
| Immigrants | Syria | 48.8 /100 | #179 | Average 13.5% |
| South Americans | 44.8 /100 | #180 | Average 13.5% |
| Venezuelans | 44.5 /100 | #181 | Average 13.5% |
| Immigrants | Colombia | 44.5 /100 | #182 | Average 13.5% |
Demographics Similar to Immigrants from Eritrea by Female Poverty
In terms of female poverty, the demographic groups most similar to Immigrants from Eritrea are Immigrants from Nigeria (14.7%, a difference of 0.31%), American (14.6%, a difference of 0.33%), Immigrants from Micronesia (14.6%, a difference of 0.33%), German Russian (14.7%, a difference of 0.45%), and Ghanaian (14.7%, a difference of 0.52%).
| Demographics | Rating | Rank | Female Poverty |
| Japanese | 4.1 /100 | #219 | Tragic 14.5% |
| Alsatians | 4.0 /100 | #220 | Tragic 14.5% |
| Immigrants | Cambodia | 3.7 /100 | #221 | Tragic 14.5% |
| Immigrants | Nonimmigrants | 3.7 /100 | #222 | Tragic 14.5% |
| Immigrants | Africa | 3.3 /100 | #223 | Tragic 14.5% |
| Americans | 2.8 /100 | #224 | Tragic 14.6% |
| Immigrants | Micronesia | 2.8 /100 | #225 | Tragic 14.6% |
| Immigrants | Eritrea | 2.4 /100 | #226 | Tragic 14.6% |
| Immigrants | Nigeria | 2.1 /100 | #227 | Tragic 14.7% |
| German Russians | 2.0 /100 | #228 | Tragic 14.7% |
| Ghanaians | 1.9 /100 | #229 | Tragic 14.7% |
| Alaska Natives | 1.8 /100 | #230 | Tragic 14.7% |
| Nigerians | 1.7 /100 | #231 | Tragic 14.8% |
| Osage | 1.5 /100 | #232 | Tragic 14.8% |
| Immigrants | Saudi Arabia | 1.4 /100 | #233 | Tragic 14.8% |