Iroquois vs Immigrants from Eritrea Female Poverty
COMPARE
Iroquois
Immigrants from Eritrea
Female Poverty
Female Poverty Comparison
Iroquois
Immigrants from Eritrea
15.8%
FEMALE POVERTY
0.1/ 100
METRIC RATING
269th/ 347
METRIC RANK
14.6%
FEMALE POVERTY
2.4/ 100
METRIC RATING
226th/ 347
METRIC RANK
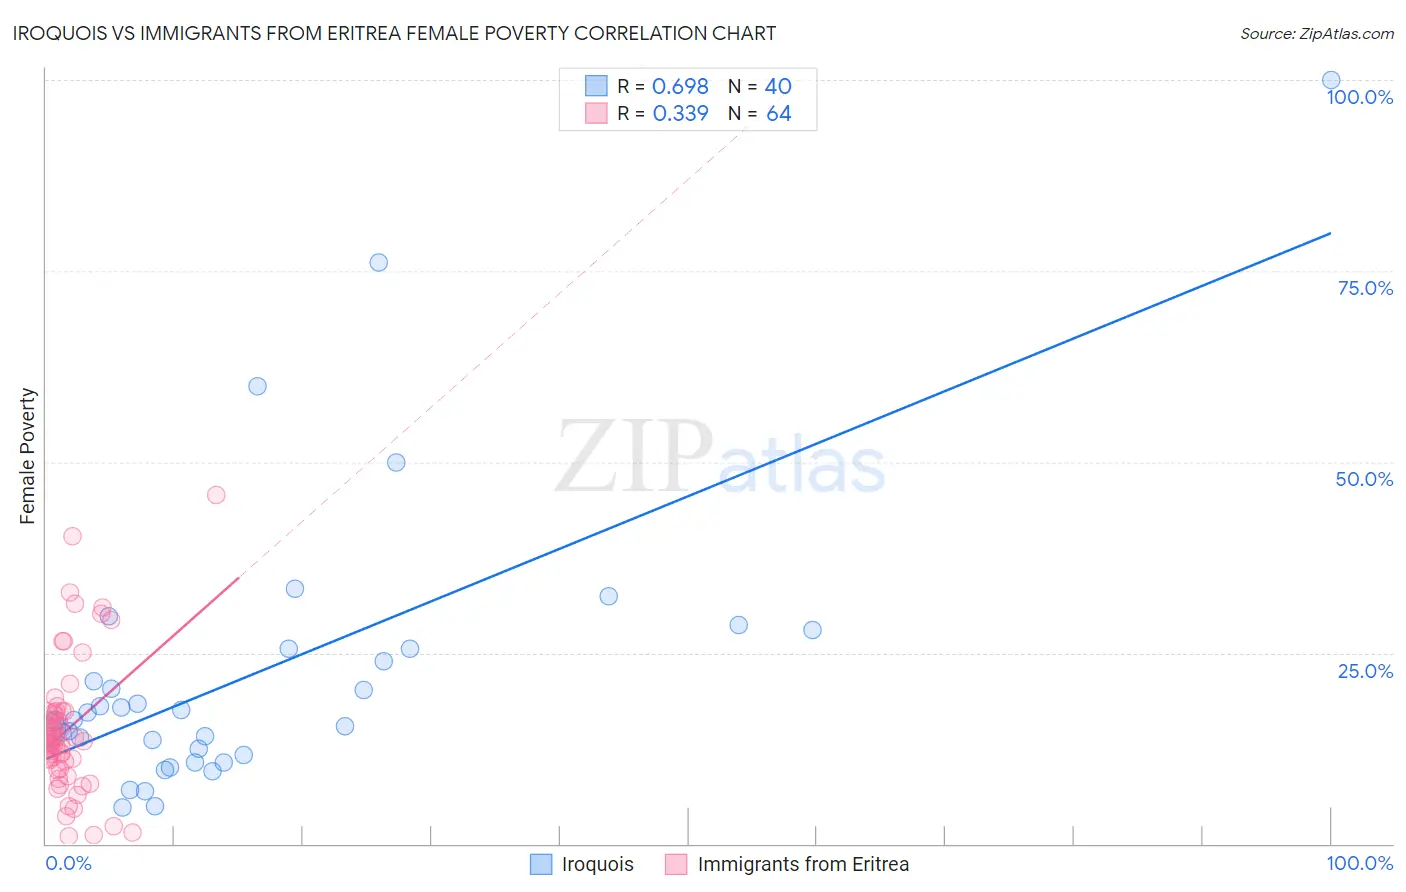
Iroquois vs Immigrants from Eritrea Female Poverty Correlation Chart
The statistical analysis conducted on geographies consisting of 207,228,109 people shows a significant positive correlation between the proportion of Iroquois and poverty level among females in the United States with a correlation coefficient (R) of 0.698 and weighted average of 15.8%. Similarly, the statistical analysis conducted on geographies consisting of 104,846,826 people shows a mild positive correlation between the proportion of Immigrants from Eritrea and poverty level among females in the United States with a correlation coefficient (R) of 0.339 and weighted average of 14.6%, a difference of 8.1%.
Female Poverty Correlation Summary
| Measurement | Iroquois | Immigrants from Eritrea |
| Minimum | 4.7% | 1.0% |
| Maximum | 100.0% | 45.6% |
| Range | 95.3% | 44.6% |
| Mean | 22.4% | 15.0% |
| Median | 16.7% | 13.6% |
| Interquartile 25% (IQ1) | 12.0% | 10.3% |
| Interquartile 75% (IQ3) | 25.5% | 17.2% |
| Interquartile Range (IQR) | 13.5% | 6.9% |
| Standard Deviation (Sample) | 19.0% | 8.9% |
| Standard Deviation (Population) | 18.8% | 8.8% |
Similar Demographics by Female Poverty
Demographics Similar to Iroquois by Female Poverty
In terms of female poverty, the demographic groups most similar to Iroquois are Chickasaw (15.9%, a difference of 0.26%), Immigrants from Nicaragua (15.8%, a difference of 0.37%), Subsaharan African (15.8%, a difference of 0.43%), Immigrants from St. Vincent and the Grenadines (15.9%, a difference of 0.54%), and Belizean (15.9%, a difference of 0.76%).
| Demographics | Rating | Rank | Female Poverty |
| Mexican American Indians | 0.1 /100 | #262 | Tragic 15.6% |
| Cherokee | 0.1 /100 | #263 | Tragic 15.6% |
| Immigrants | Ecuador | 0.1 /100 | #264 | Tragic 15.6% |
| Immigrants | Liberia | 0.1 /100 | #265 | Tragic 15.7% |
| Immigrants | El Salvador | 0.1 /100 | #266 | Tragic 15.7% |
| Sub-Saharan Africans | 0.1 /100 | #267 | Tragic 15.8% |
| Immigrants | Nicaragua | 0.1 /100 | #268 | Tragic 15.8% |
| Iroquois | 0.1 /100 | #269 | Tragic 15.8% |
| Chickasaw | 0.1 /100 | #270 | Tragic 15.9% |
| Immigrants | St. Vincent and the Grenadines | 0.0 /100 | #271 | Tragic 15.9% |
| Belizeans | 0.0 /100 | #272 | Tragic 15.9% |
| Haitians | 0.0 /100 | #273 | Tragic 15.9% |
| Barbadians | 0.0 /100 | #274 | Tragic 15.9% |
| Immigrants | Barbados | 0.0 /100 | #275 | Tragic 16.0% |
| Central Americans | 0.0 /100 | #276 | Tragic 16.0% |
Demographics Similar to Immigrants from Eritrea by Female Poverty
In terms of female poverty, the demographic groups most similar to Immigrants from Eritrea are Immigrants from Nigeria (14.7%, a difference of 0.31%), American (14.6%, a difference of 0.33%), Immigrants from Micronesia (14.6%, a difference of 0.33%), German Russian (14.7%, a difference of 0.45%), and Ghanaian (14.7%, a difference of 0.52%).
| Demographics | Rating | Rank | Female Poverty |
| Japanese | 4.1 /100 | #219 | Tragic 14.5% |
| Alsatians | 4.0 /100 | #220 | Tragic 14.5% |
| Immigrants | Cambodia | 3.7 /100 | #221 | Tragic 14.5% |
| Immigrants | Nonimmigrants | 3.7 /100 | #222 | Tragic 14.5% |
| Immigrants | Africa | 3.3 /100 | #223 | Tragic 14.5% |
| Americans | 2.8 /100 | #224 | Tragic 14.6% |
| Immigrants | Micronesia | 2.8 /100 | #225 | Tragic 14.6% |
| Immigrants | Eritrea | 2.4 /100 | #226 | Tragic 14.6% |
| Immigrants | Nigeria | 2.1 /100 | #227 | Tragic 14.7% |
| German Russians | 2.0 /100 | #228 | Tragic 14.7% |
| Ghanaians | 1.9 /100 | #229 | Tragic 14.7% |
| Alaska Natives | 1.8 /100 | #230 | Tragic 14.7% |
| Nigerians | 1.7 /100 | #231 | Tragic 14.8% |
| Osage | 1.5 /100 | #232 | Tragic 14.8% |
| Immigrants | Saudi Arabia | 1.4 /100 | #233 | Tragic 14.8% |