Latvian vs Immigrants from Eritrea Female Poverty
COMPARE
Latvian
Immigrants from Eritrea
Female Poverty
Female Poverty Comparison
Latvians
Immigrants from Eritrea
11.4%
FEMALE POVERTY
99.8/ 100
METRIC RATING
15th/ 347
METRIC RANK
14.6%
FEMALE POVERTY
2.4/ 100
METRIC RATING
226th/ 347
METRIC RANK
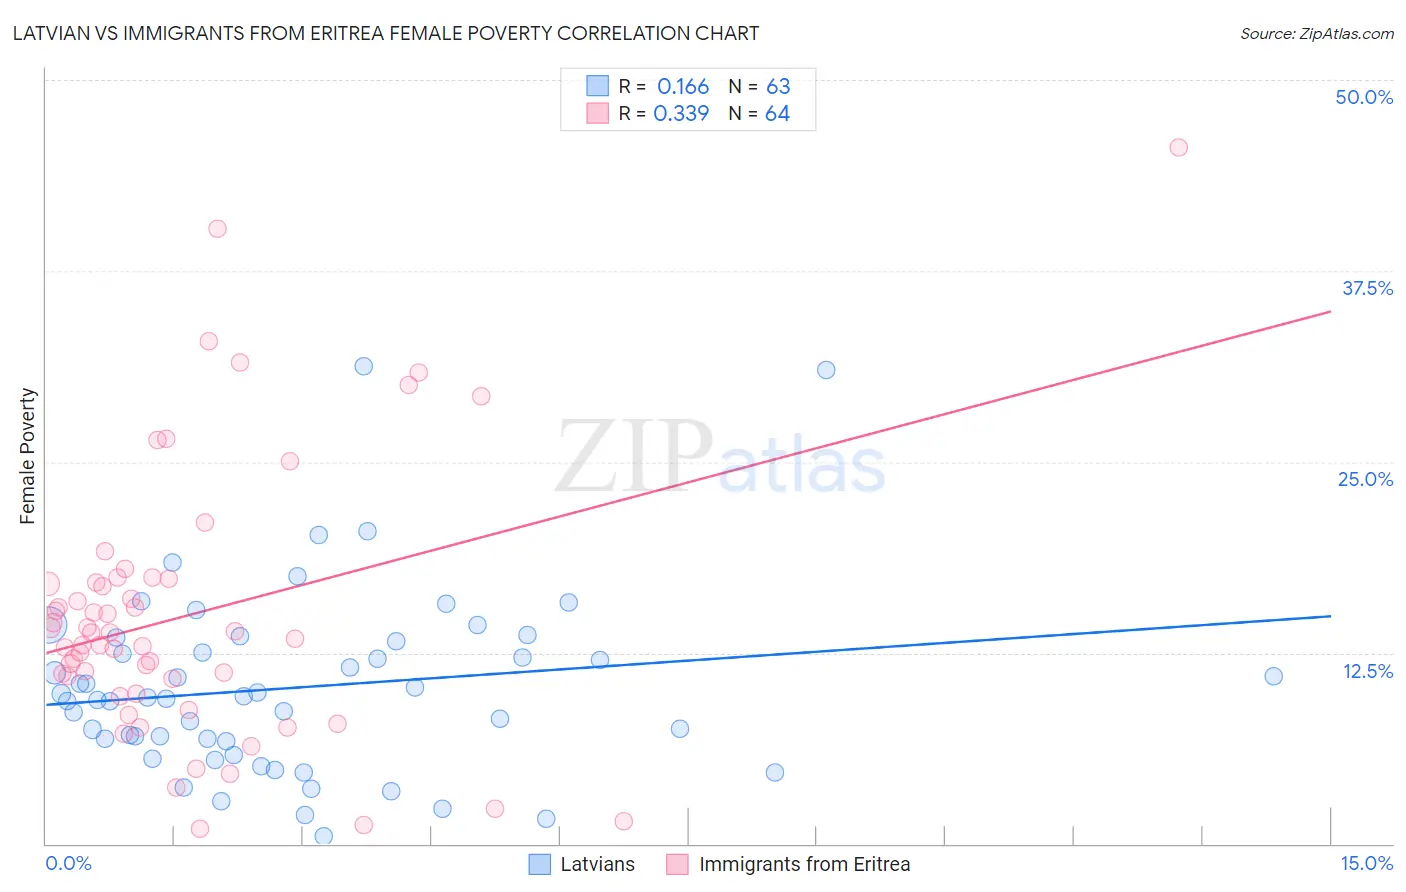
Latvian vs Immigrants from Eritrea Female Poverty Correlation Chart
The statistical analysis conducted on geographies consisting of 220,618,449 people shows a poor positive correlation between the proportion of Latvians and poverty level among females in the United States with a correlation coefficient (R) of 0.166 and weighted average of 11.4%. Similarly, the statistical analysis conducted on geographies consisting of 104,846,826 people shows a mild positive correlation between the proportion of Immigrants from Eritrea and poverty level among females in the United States with a correlation coefficient (R) of 0.339 and weighted average of 14.6%, a difference of 28.1%.
Female Poverty Correlation Summary
| Measurement | Latvian | Immigrants from Eritrea |
| Minimum | 0.50% | 1.0% |
| Maximum | 31.3% | 45.6% |
| Range | 30.8% | 44.6% |
| Mean | 10.2% | 15.0% |
| Median | 9.6% | 13.6% |
| Interquartile 25% (IQ1) | 6.7% | 10.3% |
| Interquartile 75% (IQ3) | 13.3% | 17.2% |
| Interquartile Range (IQR) | 6.5% | 6.9% |
| Standard Deviation (Sample) | 5.9% | 8.9% |
| Standard Deviation (Population) | 5.9% | 8.8% |
Similar Demographics by Female Poverty
Demographics Similar to Latvians by Female Poverty
In terms of female poverty, the demographic groups most similar to Latvians are Lithuanian (11.4%, a difference of 0.32%), Immigrants from Bolivia (11.5%, a difference of 0.47%), Bolivian (11.5%, a difference of 0.54%), Immigrants from Scotland (11.5%, a difference of 0.59%), and Norwegian (11.5%, a difference of 0.64%).
| Demographics | Rating | Rank | Female Poverty |
| Immigrants | South Central Asia | 99.9 /100 | #8 | Exceptional 11.1% |
| Bulgarians | 99.9 /100 | #9 | Exceptional 11.1% |
| Immigrants | Hong Kong | 99.9 /100 | #10 | Exceptional 11.2% |
| Maltese | 99.9 /100 | #11 | Exceptional 11.2% |
| Bhutanese | 99.9 /100 | #12 | Exceptional 11.3% |
| Immigrants | Lithuania | 99.9 /100 | #13 | Exceptional 11.3% |
| Lithuanians | 99.8 /100 | #14 | Exceptional 11.4% |
| Latvians | 99.8 /100 | #15 | Exceptional 11.4% |
| Immigrants | Bolivia | 99.8 /100 | #16 | Exceptional 11.5% |
| Bolivians | 99.8 /100 | #17 | Exceptional 11.5% |
| Immigrants | Scotland | 99.8 /100 | #18 | Exceptional 11.5% |
| Norwegians | 99.8 /100 | #19 | Exceptional 11.5% |
| Eastern Europeans | 99.7 /100 | #20 | Exceptional 11.5% |
| Italians | 99.7 /100 | #21 | Exceptional 11.6% |
| Swedes | 99.7 /100 | #22 | Exceptional 11.6% |
Demographics Similar to Immigrants from Eritrea by Female Poverty
In terms of female poverty, the demographic groups most similar to Immigrants from Eritrea are Immigrants from Nigeria (14.7%, a difference of 0.31%), American (14.6%, a difference of 0.33%), Immigrants from Micronesia (14.6%, a difference of 0.33%), German Russian (14.7%, a difference of 0.45%), and Ghanaian (14.7%, a difference of 0.52%).
| Demographics | Rating | Rank | Female Poverty |
| Japanese | 4.1 /100 | #219 | Tragic 14.5% |
| Alsatians | 4.0 /100 | #220 | Tragic 14.5% |
| Immigrants | Cambodia | 3.7 /100 | #221 | Tragic 14.5% |
| Immigrants | Nonimmigrants | 3.7 /100 | #222 | Tragic 14.5% |
| Immigrants | Africa | 3.3 /100 | #223 | Tragic 14.5% |
| Americans | 2.8 /100 | #224 | Tragic 14.6% |
| Immigrants | Micronesia | 2.8 /100 | #225 | Tragic 14.6% |
| Immigrants | Eritrea | 2.4 /100 | #226 | Tragic 14.6% |
| Immigrants | Nigeria | 2.1 /100 | #227 | Tragic 14.7% |
| German Russians | 2.0 /100 | #228 | Tragic 14.7% |
| Ghanaians | 1.9 /100 | #229 | Tragic 14.7% |
| Alaska Natives | 1.8 /100 | #230 | Tragic 14.7% |
| Nigerians | 1.7 /100 | #231 | Tragic 14.8% |
| Osage | 1.5 /100 | #232 | Tragic 14.8% |
| Immigrants | Saudi Arabia | 1.4 /100 | #233 | Tragic 14.8% |