Salvadoran vs Central American Female Poverty
COMPARE
Salvadoran
Central American
Female Poverty
Female Poverty Comparison
Salvadorans
Central Americans
15.3%
FEMALE POVERTY
0.3/ 100
METRIC RATING
249th/ 347
METRIC RANK
16.0%
FEMALE POVERTY
0.0/ 100
METRIC RATING
276th/ 347
METRIC RANK
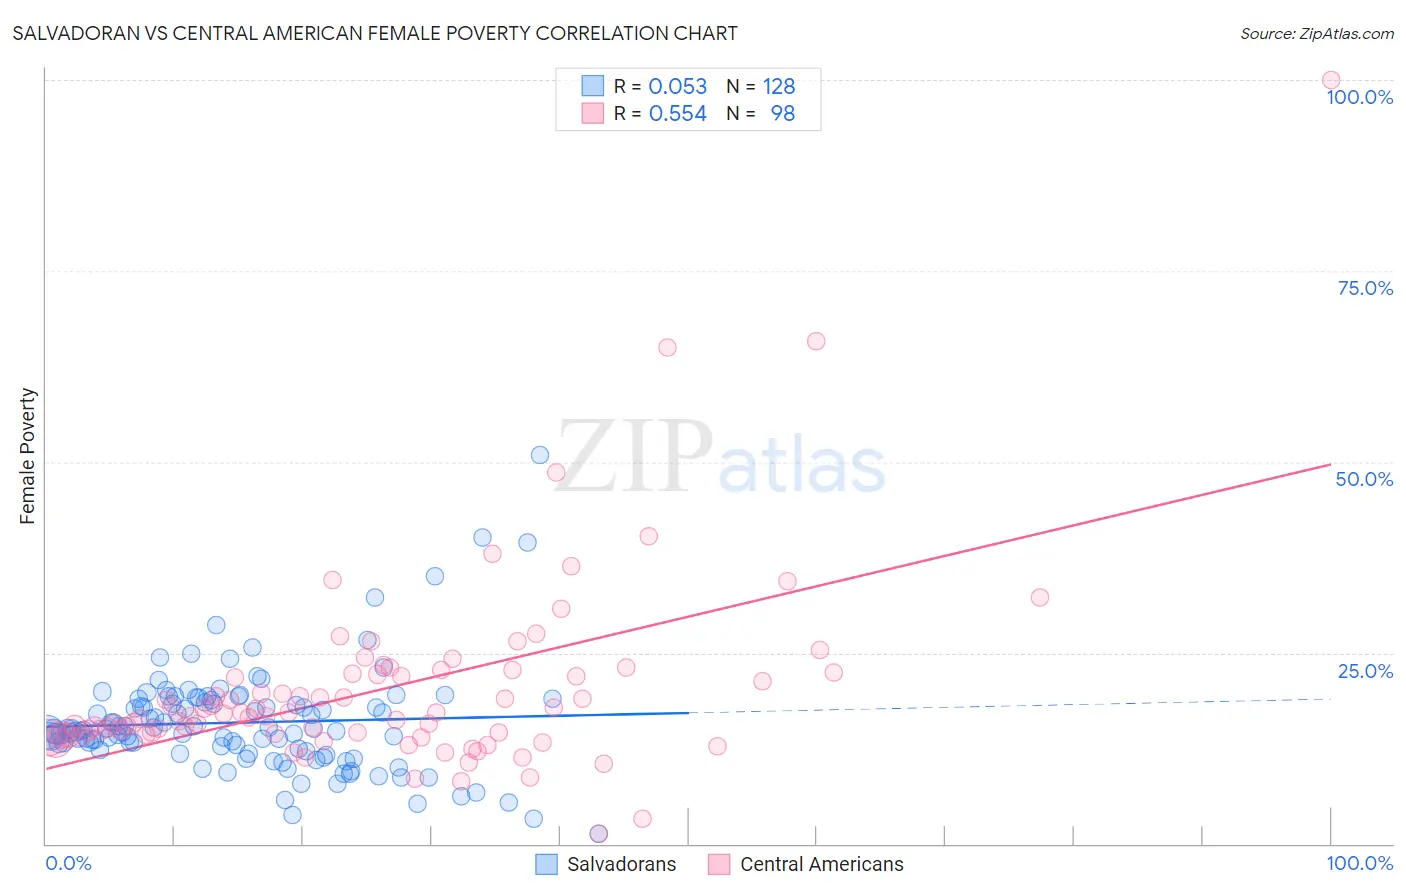
Salvadoran vs Central American Female Poverty Correlation Chart
The statistical analysis conducted on geographies consisting of 398,655,447 people shows a slight positive correlation between the proportion of Salvadorans and poverty level among females in the United States with a correlation coefficient (R) of 0.053 and weighted average of 15.3%. Similarly, the statistical analysis conducted on geographies consisting of 503,924,730 people shows a substantial positive correlation between the proportion of Central Americans and poverty level among females in the United States with a correlation coefficient (R) of 0.554 and weighted average of 16.0%, a difference of 4.2%.
Female Poverty Correlation Summary
| Measurement | Salvadoran | Central American |
| Minimum | 1.3% | 1.3% |
| Maximum | 50.9% | 100.0% |
| Range | 49.7% | 98.8% |
| Mean | 15.9% | 20.2% |
| Median | 14.9% | 16.9% |
| Interquartile 25% (IQ1) | 12.3% | 14.3% |
| Interquartile 75% (IQ3) | 18.6% | 22.2% |
| Interquartile Range (IQR) | 6.3% | 7.9% |
| Standard Deviation (Sample) | 6.9% | 12.8% |
| Standard Deviation (Population) | 6.9% | 12.8% |
Similar Demographics by Female Poverty
Demographics Similar to Salvadorans by Female Poverty
In terms of female poverty, the demographic groups most similar to Salvadorans are Immigrants from Western Africa (15.3%, a difference of 0.040%), Potawatomi (15.3%, a difference of 0.14%), Immigrants from Ghana (15.3%, a difference of 0.14%), Cuban (15.3%, a difference of 0.15%), and Spanish American Indian (15.3%, a difference of 0.20%).
| Demographics | Rating | Rank | Female Poverty |
| Nepalese | 0.4 /100 | #242 | Tragic 15.2% |
| Nicaraguans | 0.3 /100 | #243 | Tragic 15.3% |
| Ecuadorians | 0.3 /100 | #244 | Tragic 15.3% |
| Spanish American Indians | 0.3 /100 | #245 | Tragic 15.3% |
| Cubans | 0.3 /100 | #246 | Tragic 15.3% |
| Potawatomi | 0.3 /100 | #247 | Tragic 15.3% |
| Immigrants | Ghana | 0.3 /100 | #248 | Tragic 15.3% |
| Salvadorans | 0.3 /100 | #249 | Tragic 15.3% |
| Immigrants | Western Africa | 0.3 /100 | #250 | Tragic 15.3% |
| Immigrants | Trinidad and Tobago | 0.3 /100 | #251 | Tragic 15.4% |
| Immigrants | Burma/Myanmar | 0.3 /100 | #252 | Tragic 15.4% |
| Liberians | 0.2 /100 | #253 | Tragic 15.4% |
| Trinidadians and Tobagonians | 0.2 /100 | #254 | Tragic 15.4% |
| Ottawa | 0.2 /100 | #255 | Tragic 15.5% |
| Jamaicans | 0.2 /100 | #256 | Tragic 15.5% |
Demographics Similar to Central Americans by Female Poverty
In terms of female poverty, the demographic groups most similar to Central Americans are Immigrants from Barbados (16.0%, a difference of 0.13%), Barbadian (15.9%, a difference of 0.19%), Bangladeshi (16.0%, a difference of 0.19%), Belizean (15.9%, a difference of 0.20%), and Haitian (15.9%, a difference of 0.20%).
| Demographics | Rating | Rank | Female Poverty |
| Iroquois | 0.1 /100 | #269 | Tragic 15.8% |
| Chickasaw | 0.1 /100 | #270 | Tragic 15.9% |
| Immigrants | St. Vincent and the Grenadines | 0.0 /100 | #271 | Tragic 15.9% |
| Belizeans | 0.0 /100 | #272 | Tragic 15.9% |
| Haitians | 0.0 /100 | #273 | Tragic 15.9% |
| Barbadians | 0.0 /100 | #274 | Tragic 15.9% |
| Immigrants | Barbados | 0.0 /100 | #275 | Tragic 16.0% |
| Central Americans | 0.0 /100 | #276 | Tragic 16.0% |
| Bangladeshis | 0.0 /100 | #277 | Tragic 16.0% |
| Immigrants | West Indies | 0.0 /100 | #278 | Tragic 16.1% |
| Immigrants | Bahamas | 0.0 /100 | #279 | Tragic 16.1% |
| Vietnamese | 0.0 /100 | #280 | Tragic 16.1% |
| West Indians | 0.0 /100 | #281 | Tragic 16.1% |
| Immigrants | Haiti | 0.0 /100 | #282 | Tragic 16.1% |
| Immigrants | Cuba | 0.0 /100 | #283 | Tragic 16.1% |