Spanish vs Immigrants from Eritrea Female Poverty
COMPARE
Spanish
Immigrants from Eritrea
Female Poverty
Female Poverty Comparison
Spanish
Immigrants from Eritrea
13.9%
FEMALE POVERTY
21.4/ 100
METRIC RATING
200th/ 347
METRIC RANK
14.6%
FEMALE POVERTY
2.4/ 100
METRIC RATING
226th/ 347
METRIC RANK
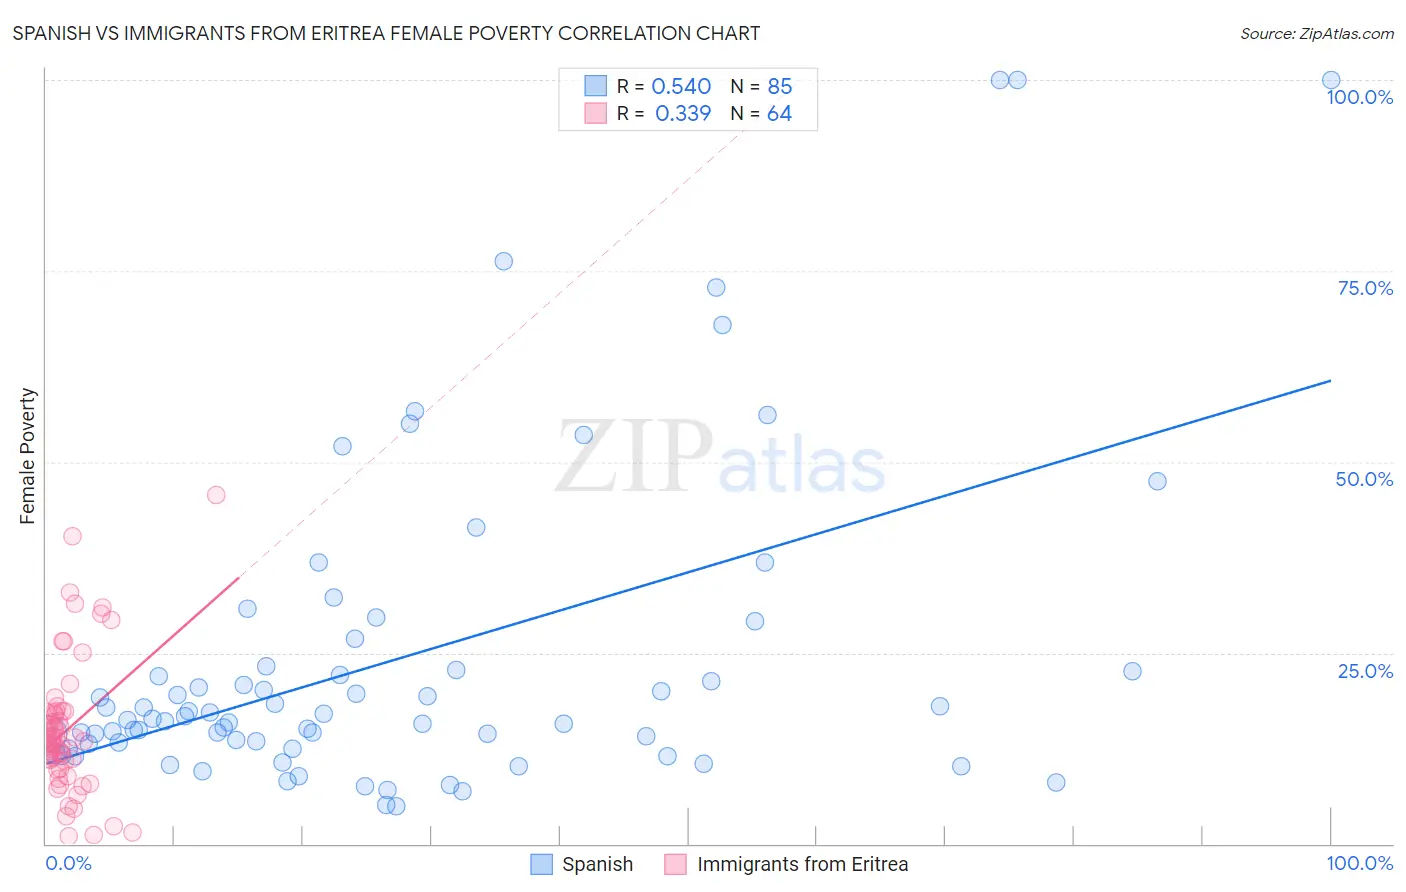
Spanish vs Immigrants from Eritrea Female Poverty Correlation Chart
The statistical analysis conducted on geographies consisting of 421,834,195 people shows a substantial positive correlation between the proportion of Spanish and poverty level among females in the United States with a correlation coefficient (R) of 0.540 and weighted average of 13.9%. Similarly, the statistical analysis conducted on geographies consisting of 104,846,826 people shows a mild positive correlation between the proportion of Immigrants from Eritrea and poverty level among females in the United States with a correlation coefficient (R) of 0.339 and weighted average of 14.6%, a difference of 5.6%.
Female Poverty Correlation Summary
| Measurement | Spanish | Immigrants from Eritrea |
| Minimum | 5.0% | 1.0% |
| Maximum | 100.0% | 45.6% |
| Range | 95.0% | 44.6% |
| Mean | 24.2% | 15.0% |
| Median | 16.3% | 13.6% |
| Interquartile 25% (IQ1) | 12.8% | 10.3% |
| Interquartile 75% (IQ3) | 23.0% | 17.2% |
| Interquartile Range (IQR) | 10.2% | 6.9% |
| Standard Deviation (Sample) | 21.1% | 8.9% |
| Standard Deviation (Population) | 21.0% | 8.8% |
Similar Demographics by Female Poverty
Demographics Similar to Spanish by Female Poverty
In terms of female poverty, the demographic groups most similar to Spanish are Immigrants from Kenya (13.9%, a difference of 0.040%), Hmong (13.9%, a difference of 0.050%), Immigrants from Western Asia (13.9%, a difference of 0.10%), Spaniard (13.9%, a difference of 0.37%), and Immigrants from Lebanon (13.8%, a difference of 0.55%).
| Demographics | Rating | Rank | Female Poverty |
| Iraqis | 31.8 /100 | #193 | Fair 13.7% |
| Delaware | 31.1 /100 | #194 | Fair 13.7% |
| Immigrants | South America | 30.6 /100 | #195 | Fair 13.7% |
| South American Indians | 28.9 /100 | #196 | Fair 13.7% |
| Arabs | 28.6 /100 | #197 | Fair 13.7% |
| Immigrants | Uganda | 28.5 /100 | #198 | Fair 13.7% |
| Immigrants | Lebanon | 25.6 /100 | #199 | Fair 13.8% |
| Spanish | 21.4 /100 | #200 | Fair 13.9% |
| Immigrants | Kenya | 21.1 /100 | #201 | Fair 13.9% |
| Hmong | 21.1 /100 | #202 | Fair 13.9% |
| Immigrants | Western Asia | 20.7 /100 | #203 | Fair 13.9% |
| Spaniards | 18.9 /100 | #204 | Poor 13.9% |
| Ugandans | 15.4 /100 | #205 | Poor 14.0% |
| Immigrants | Uruguay | 14.0 /100 | #206 | Poor 14.0% |
| Immigrants | Eastern Africa | 9.0 /100 | #207 | Tragic 14.2% |
Demographics Similar to Immigrants from Eritrea by Female Poverty
In terms of female poverty, the demographic groups most similar to Immigrants from Eritrea are Immigrants from Nigeria (14.7%, a difference of 0.31%), American (14.6%, a difference of 0.33%), Immigrants from Micronesia (14.6%, a difference of 0.33%), German Russian (14.7%, a difference of 0.45%), and Ghanaian (14.7%, a difference of 0.52%).
| Demographics | Rating | Rank | Female Poverty |
| Japanese | 4.1 /100 | #219 | Tragic 14.5% |
| Alsatians | 4.0 /100 | #220 | Tragic 14.5% |
| Immigrants | Cambodia | 3.7 /100 | #221 | Tragic 14.5% |
| Immigrants | Nonimmigrants | 3.7 /100 | #222 | Tragic 14.5% |
| Immigrants | Africa | 3.3 /100 | #223 | Tragic 14.5% |
| Americans | 2.8 /100 | #224 | Tragic 14.6% |
| Immigrants | Micronesia | 2.8 /100 | #225 | Tragic 14.6% |
| Immigrants | Eritrea | 2.4 /100 | #226 | Tragic 14.6% |
| Immigrants | Nigeria | 2.1 /100 | #227 | Tragic 14.7% |
| German Russians | 2.0 /100 | #228 | Tragic 14.7% |
| Ghanaians | 1.9 /100 | #229 | Tragic 14.7% |
| Alaska Natives | 1.8 /100 | #230 | Tragic 14.7% |
| Nigerians | 1.7 /100 | #231 | Tragic 14.8% |
| Osage | 1.5 /100 | #232 | Tragic 14.8% |
| Immigrants | Saudi Arabia | 1.4 /100 | #233 | Tragic 14.8% |