Peruvian vs Tohono O'odham Receiving Food Stamps
COMPARE
Peruvian
Tohono O'odham
Receiving Food Stamps
Receiving Food Stamps Comparison
Peruvians
Tohono O'odham
11.7%
RECEIVING FOOD STAMPS
49.3/ 100
METRIC RATING
176th/ 347
METRIC RANK
21.5%
RECEIVING FOOD STAMPS
0.0/ 100
METRIC RATING
340th/ 347
METRIC RANK
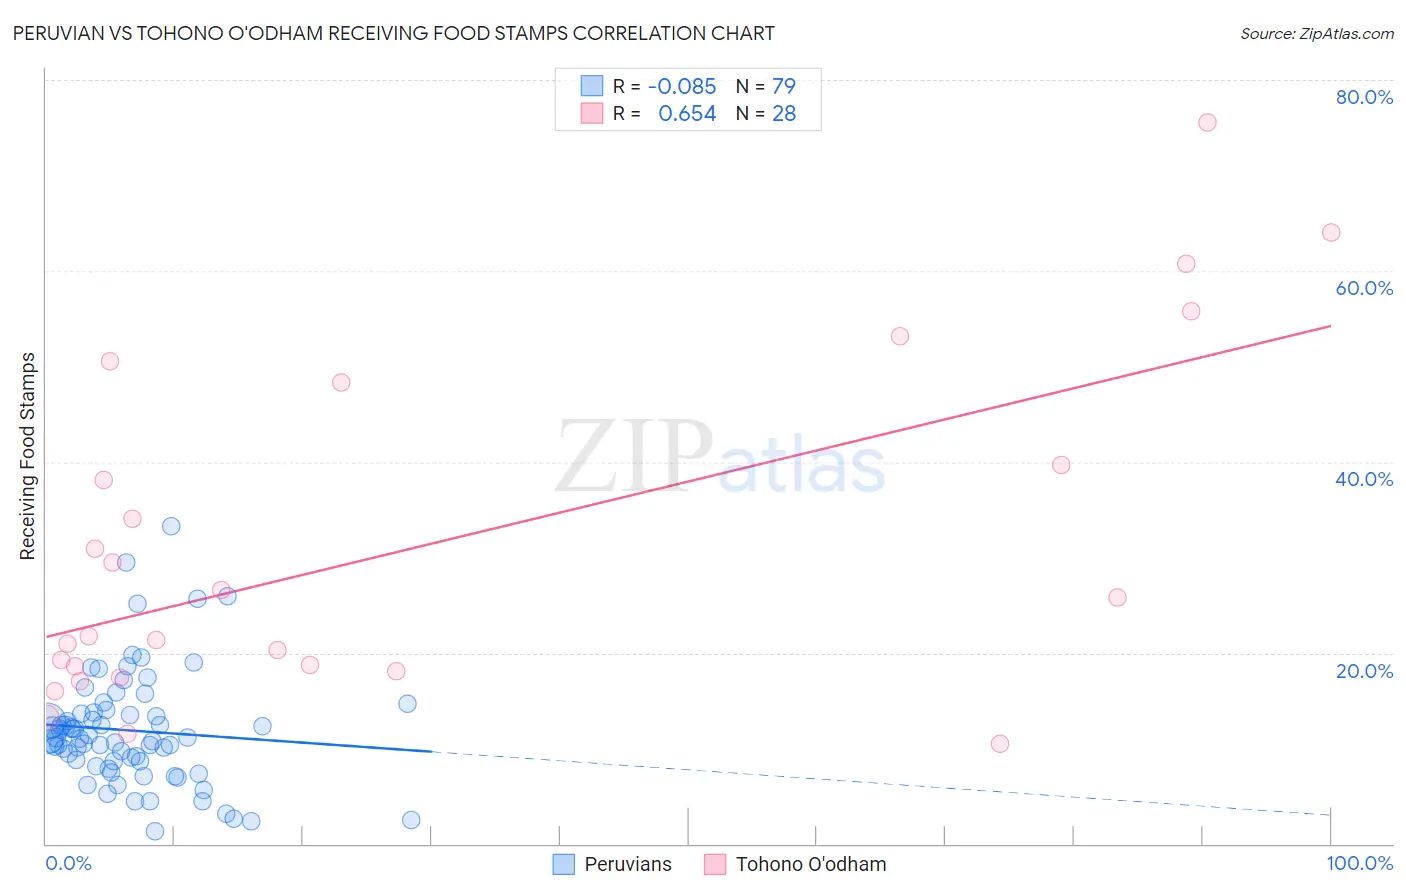
Peruvian vs Tohono O'odham Receiving Food Stamps Correlation Chart
The statistical analysis conducted on geographies consisting of 362,284,397 people shows a slight negative correlation between the proportion of Peruvians and percentage of population receiving government assistance and/or food stamps in the United States with a correlation coefficient (R) of -0.085 and weighted average of 11.7%. Similarly, the statistical analysis conducted on geographies consisting of 58,698,945 people shows a significant positive correlation between the proportion of Tohono O'odham and percentage of population receiving government assistance and/or food stamps in the United States with a correlation coefficient (R) of 0.654 and weighted average of 21.5%, a difference of 82.8%.
Receiving Food Stamps Correlation Summary
| Measurement | Peruvian | Tohono O'odham |
| Minimum | 1.3% | 10.5% |
| Maximum | 33.2% | 75.6% |
| Range | 31.9% | 65.1% |
| Mean | 11.9% | 31.3% |
| Median | 11.0% | 23.7% |
| Interquartile 25% (IQ1) | 8.7% | 18.4% |
| Interquartile 75% (IQ3) | 13.8% | 44.0% |
| Interquartile Range (IQR) | 5.1% | 25.6% |
| Standard Deviation (Sample) | 6.0% | 17.9% |
| Standard Deviation (Population) | 5.9% | 17.6% |
Similar Demographics by Receiving Food Stamps
Demographics Similar to Peruvians by Receiving Food Stamps
In terms of receiving food stamps, the demographic groups most similar to Peruvians are Osage (11.7%, a difference of 0.070%), Immigrants from Eritrea (11.7%, a difference of 0.10%), Immigrants from Ukraine (11.8%, a difference of 0.13%), German Russian (11.8%, a difference of 0.17%), and Immigrants from Kenya (11.8%, a difference of 0.41%).
| Demographics | Rating | Rank | Receiving Food Stamps |
| Immigrants | Eastern Africa | 58.3 /100 | #169 | Average 11.6% |
| Costa Ricans | 57.9 /100 | #170 | Average 11.6% |
| Immigrants | Western Asia | 56.4 /100 | #171 | Average 11.6% |
| Guamanians/Chamorros | 54.2 /100 | #172 | Average 11.7% |
| Immigrants | Syria | 53.4 /100 | #173 | Average 11.7% |
| Immigrants | Eritrea | 50.0 /100 | #174 | Average 11.7% |
| Osage | 49.8 /100 | #175 | Average 11.7% |
| Peruvians | 49.3 /100 | #176 | Average 11.7% |
| Immigrants | Ukraine | 48.4 /100 | #177 | Average 11.8% |
| German Russians | 48.1 /100 | #178 | Average 11.8% |
| Immigrants | Kenya | 46.4 /100 | #179 | Average 11.8% |
| Uruguayans | 44.8 /100 | #180 | Average 11.8% |
| South American Indians | 41.7 /100 | #181 | Average 11.9% |
| Immigrants | Morocco | 40.7 /100 | #182 | Average 11.9% |
| Immigrants | Uganda | 40.3 /100 | #183 | Average 11.9% |
Demographics Similar to Tohono O'odham by Receiving Food Stamps
In terms of receiving food stamps, the demographic groups most similar to Tohono O'odham are Yakama (21.4%, a difference of 0.26%), Hopi (21.6%, a difference of 0.37%), Dominican (21.4%, a difference of 0.52%), Immigrants from Yemen (21.6%, a difference of 0.78%), and Cape Verdean (21.1%, a difference of 1.9%).
| Demographics | Rating | Rank | Receiving Food Stamps |
| Inupiat | 0.0 /100 | #333 | Tragic 20.1% |
| Yuman | 0.0 /100 | #334 | Tragic 20.2% |
| Immigrants | Cuba | 0.0 /100 | #335 | Tragic 20.8% |
| Navajo | 0.0 /100 | #336 | Tragic 21.1% |
| Cape Verdeans | 0.0 /100 | #337 | Tragic 21.1% |
| Dominicans | 0.0 /100 | #338 | Tragic 21.4% |
| Yakama | 0.0 /100 | #339 | Tragic 21.4% |
| Tohono O'odham | 0.0 /100 | #340 | Tragic 21.5% |
| Hopi | 0.0 /100 | #341 | Tragic 21.6% |
| Immigrants | Yemen | 0.0 /100 | #342 | Tragic 21.6% |
| Immigrants | Dominican Republic | 0.0 /100 | #343 | Tragic 22.1% |
| Lumbee | 0.0 /100 | #344 | Tragic 22.9% |
| Immigrants | Cabo Verde | 0.0 /100 | #345 | Tragic 23.8% |
| Puerto Ricans | 0.0 /100 | #346 | Tragic 26.0% |
| Yup'ik | 0.0 /100 | #347 | Tragic 32.7% |