Spaniard vs Tohono O'odham Receiving Food Stamps
COMPARE
Spaniard
Tohono O'odham
Receiving Food Stamps
Receiving Food Stamps Comparison
Spaniards
Tohono O'odham
11.9%
RECEIVING FOOD STAMPS
39.8/ 100
METRIC RATING
184th/ 347
METRIC RANK
21.5%
RECEIVING FOOD STAMPS
0.0/ 100
METRIC RATING
340th/ 347
METRIC RANK
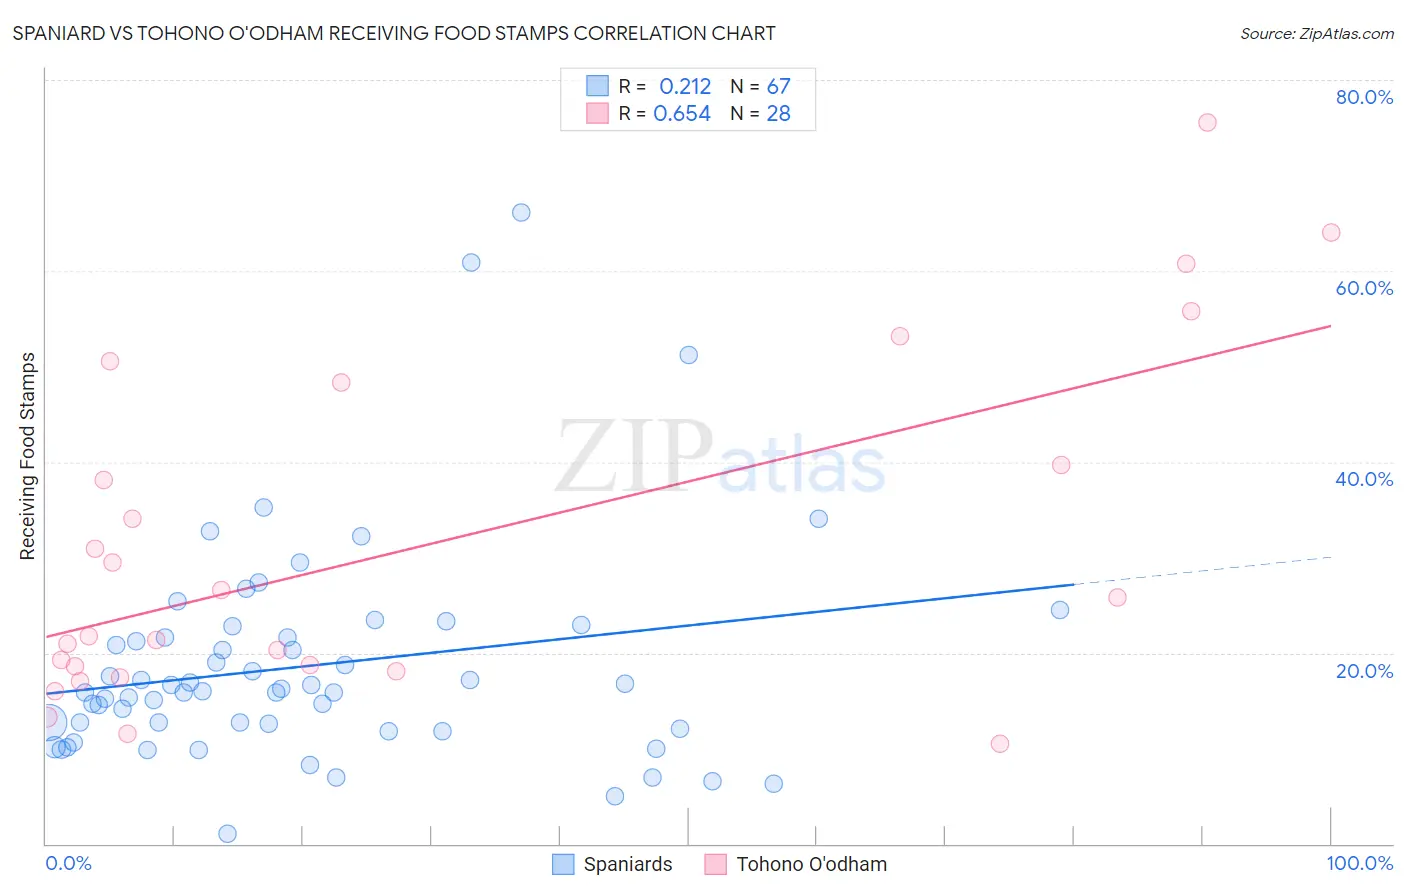
Spaniard vs Tohono O'odham Receiving Food Stamps Correlation Chart
The statistical analysis conducted on geographies consisting of 442,043,399 people shows a weak positive correlation between the proportion of Spaniards and percentage of population receiving government assistance and/or food stamps in the United States with a correlation coefficient (R) of 0.212 and weighted average of 11.9%. Similarly, the statistical analysis conducted on geographies consisting of 58,698,945 people shows a significant positive correlation between the proportion of Tohono O'odham and percentage of population receiving government assistance and/or food stamps in the United States with a correlation coefficient (R) of 0.654 and weighted average of 21.5%, a difference of 80.3%.
Receiving Food Stamps Correlation Summary
| Measurement | Spaniard | Tohono O'odham |
| Minimum | 1.0% | 10.5% |
| Maximum | 66.1% | 75.6% |
| Range | 65.1% | 65.1% |
| Mean | 18.6% | 31.3% |
| Median | 15.9% | 23.7% |
| Interquartile 25% (IQ1) | 12.0% | 18.4% |
| Interquartile 75% (IQ3) | 21.6% | 44.0% |
| Interquartile Range (IQR) | 9.6% | 25.6% |
| Standard Deviation (Sample) | 11.4% | 17.9% |
| Standard Deviation (Population) | 11.4% | 17.6% |
Similar Demographics by Receiving Food Stamps
Demographics Similar to Spaniards by Receiving Food Stamps
In terms of receiving food stamps, the demographic groups most similar to Spaniards are Immigrants from Uganda (11.9%, a difference of 0.080%), Immigrants from Morocco (11.9%, a difference of 0.13%), South American Indian (11.9%, a difference of 0.28%), Immigrants from Iraq (12.0%, a difference of 0.38%), and Spanish (12.0%, a difference of 0.42%).
| Demographics | Rating | Rank | Receiving Food Stamps |
| Immigrants | Ukraine | 48.4 /100 | #177 | Average 11.8% |
| German Russians | 48.1 /100 | #178 | Average 11.8% |
| Immigrants | Kenya | 46.4 /100 | #179 | Average 11.8% |
| Uruguayans | 44.8 /100 | #180 | Average 11.8% |
| South American Indians | 41.7 /100 | #181 | Average 11.9% |
| Immigrants | Morocco | 40.7 /100 | #182 | Average 11.9% |
| Immigrants | Uganda | 40.3 /100 | #183 | Average 11.9% |
| Spaniards | 39.8 /100 | #184 | Fair 11.9% |
| Immigrants | Iraq | 37.1 /100 | #185 | Fair 12.0% |
| Spanish | 36.9 /100 | #186 | Fair 12.0% |
| Albanians | 35.4 /100 | #187 | Fair 12.0% |
| Sudanese | 33.4 /100 | #188 | Fair 12.0% |
| Immigrants | Cameroon | 32.5 /100 | #189 | Fair 12.0% |
| Immigrants | Peru | 32.2 /100 | #190 | Fair 12.0% |
| Venezuelans | 32.1 /100 | #191 | Fair 12.0% |
Demographics Similar to Tohono O'odham by Receiving Food Stamps
In terms of receiving food stamps, the demographic groups most similar to Tohono O'odham are Yakama (21.4%, a difference of 0.26%), Hopi (21.6%, a difference of 0.37%), Dominican (21.4%, a difference of 0.52%), Immigrants from Yemen (21.6%, a difference of 0.78%), and Cape Verdean (21.1%, a difference of 1.9%).
| Demographics | Rating | Rank | Receiving Food Stamps |
| Inupiat | 0.0 /100 | #333 | Tragic 20.1% |
| Yuman | 0.0 /100 | #334 | Tragic 20.2% |
| Immigrants | Cuba | 0.0 /100 | #335 | Tragic 20.8% |
| Navajo | 0.0 /100 | #336 | Tragic 21.1% |
| Cape Verdeans | 0.0 /100 | #337 | Tragic 21.1% |
| Dominicans | 0.0 /100 | #338 | Tragic 21.4% |
| Yakama | 0.0 /100 | #339 | Tragic 21.4% |
| Tohono O'odham | 0.0 /100 | #340 | Tragic 21.5% |
| Hopi | 0.0 /100 | #341 | Tragic 21.6% |
| Immigrants | Yemen | 0.0 /100 | #342 | Tragic 21.6% |
| Immigrants | Dominican Republic | 0.0 /100 | #343 | Tragic 22.1% |
| Lumbee | 0.0 /100 | #344 | Tragic 22.9% |
| Immigrants | Cabo Verde | 0.0 /100 | #345 | Tragic 23.8% |
| Puerto Ricans | 0.0 /100 | #346 | Tragic 26.0% |
| Yup'ik | 0.0 /100 | #347 | Tragic 32.7% |