Guyanese vs Tohono O'odham Receiving Food Stamps
COMPARE
Guyanese
Tohono O'odham
Receiving Food Stamps
Receiving Food Stamps Comparison
Guyanese
Tohono O'odham
16.7%
RECEIVING FOOD STAMPS
0.0/ 100
METRIC RATING
311th/ 347
METRIC RANK
21.5%
RECEIVING FOOD STAMPS
0.0/ 100
METRIC RATING
340th/ 347
METRIC RANK
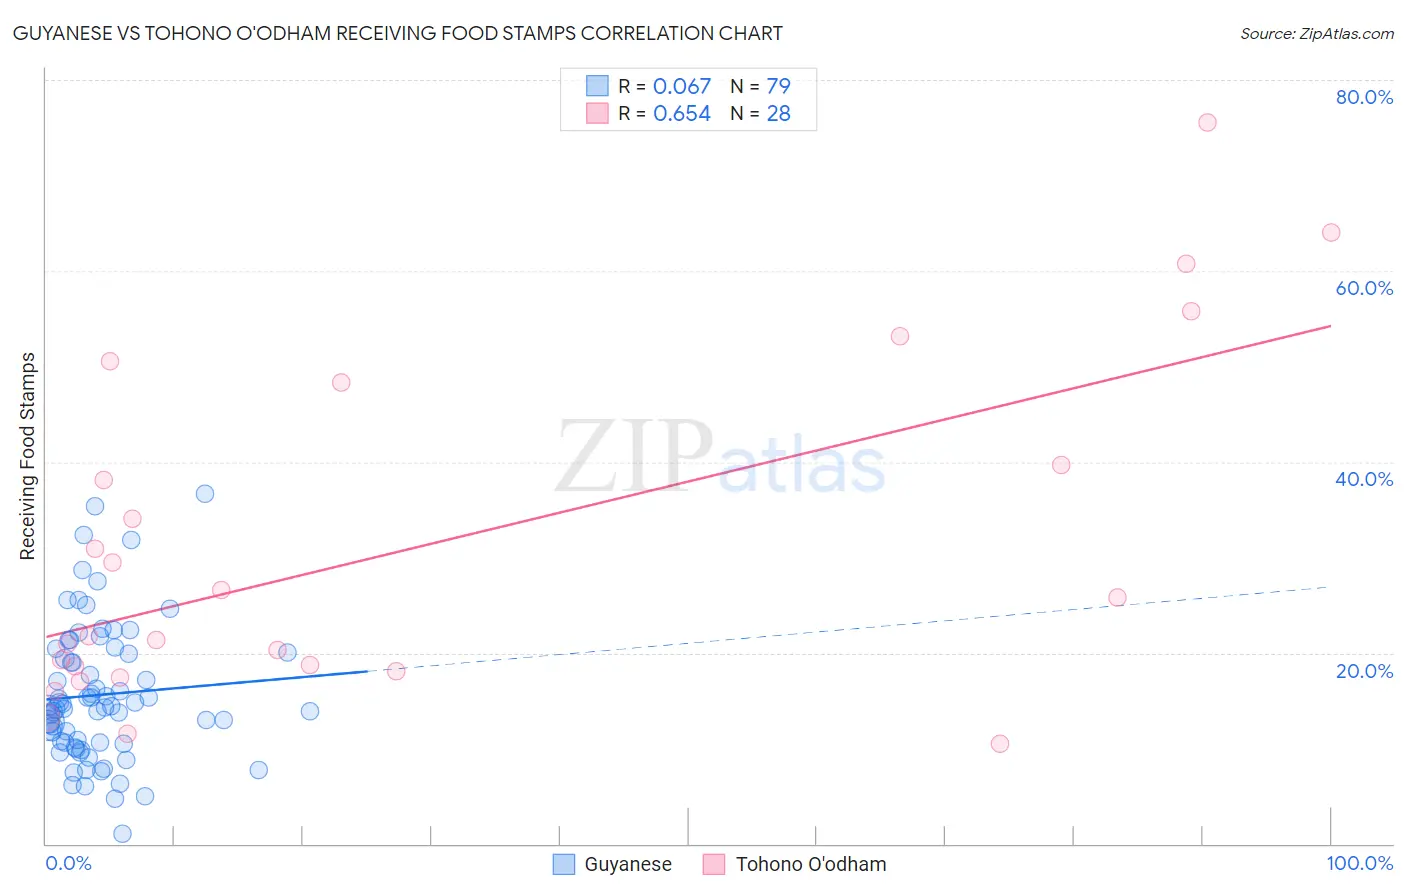
Guyanese vs Tohono O'odham Receiving Food Stamps Correlation Chart
The statistical analysis conducted on geographies consisting of 176,625,032 people shows a slight positive correlation between the proportion of Guyanese and percentage of population receiving government assistance and/or food stamps in the United States with a correlation coefficient (R) of 0.067 and weighted average of 16.7%. Similarly, the statistical analysis conducted on geographies consisting of 58,698,945 people shows a significant positive correlation between the proportion of Tohono O'odham and percentage of population receiving government assistance and/or food stamps in the United States with a correlation coefficient (R) of 0.654 and weighted average of 21.5%, a difference of 28.5%.
Receiving Food Stamps Correlation Summary
| Measurement | Guyanese | Tohono O'odham |
| Minimum | 1.0% | 10.5% |
| Maximum | 36.6% | 75.6% |
| Range | 35.6% | 65.1% |
| Mean | 15.6% | 31.3% |
| Median | 14.4% | 23.7% |
| Interquartile 25% (IQ1) | 10.6% | 18.4% |
| Interquartile 75% (IQ3) | 20.0% | 44.0% |
| Interquartile Range (IQR) | 9.4% | 25.6% |
| Standard Deviation (Sample) | 7.1% | 17.9% |
| Standard Deviation (Population) | 7.1% | 17.6% |
Similar Demographics by Receiving Food Stamps
Demographics Similar to Guyanese by Receiving Food Stamps
In terms of receiving food stamps, the demographic groups most similar to Guyanese are Immigrants from Barbados (16.6%, a difference of 0.52%), Sioux (16.8%, a difference of 0.70%), Immigrants from Jamaica (16.9%, a difference of 0.98%), U.S. Virgin Islander (16.5%, a difference of 1.1%), and Immigrants from Guyana (16.9%, a difference of 1.2%).
| Demographics | Rating | Rank | Receiving Food Stamps |
| West Indians | 0.0 /100 | #304 | Tragic 16.3% |
| Immigrants | Azores | 0.0 /100 | #305 | Tragic 16.4% |
| Jamaicans | 0.0 /100 | #306 | Tragic 16.4% |
| Houma | 0.0 /100 | #307 | Tragic 16.5% |
| Barbadians | 0.0 /100 | #308 | Tragic 16.5% |
| U.S. Virgin Islanders | 0.0 /100 | #309 | Tragic 16.5% |
| Immigrants | Barbados | 0.0 /100 | #310 | Tragic 16.6% |
| Guyanese | 0.0 /100 | #311 | Tragic 16.7% |
| Sioux | 0.0 /100 | #312 | Tragic 16.8% |
| Immigrants | Jamaica | 0.0 /100 | #313 | Tragic 16.9% |
| Immigrants | Guyana | 0.0 /100 | #314 | Tragic 16.9% |
| Bahamians | 0.0 /100 | #315 | Tragic 17.0% |
| Central American Indians | 0.0 /100 | #316 | Tragic 17.1% |
| Blacks/African Americans | 0.0 /100 | #317 | Tragic 17.2% |
| Menominee | 0.0 /100 | #318 | Tragic 17.2% |
Demographics Similar to Tohono O'odham by Receiving Food Stamps
In terms of receiving food stamps, the demographic groups most similar to Tohono O'odham are Yakama (21.4%, a difference of 0.26%), Hopi (21.6%, a difference of 0.37%), Dominican (21.4%, a difference of 0.52%), Immigrants from Yemen (21.6%, a difference of 0.78%), and Cape Verdean (21.1%, a difference of 1.9%).
| Demographics | Rating | Rank | Receiving Food Stamps |
| Inupiat | 0.0 /100 | #333 | Tragic 20.1% |
| Yuman | 0.0 /100 | #334 | Tragic 20.2% |
| Immigrants | Cuba | 0.0 /100 | #335 | Tragic 20.8% |
| Navajo | 0.0 /100 | #336 | Tragic 21.1% |
| Cape Verdeans | 0.0 /100 | #337 | Tragic 21.1% |
| Dominicans | 0.0 /100 | #338 | Tragic 21.4% |
| Yakama | 0.0 /100 | #339 | Tragic 21.4% |
| Tohono O'odham | 0.0 /100 | #340 | Tragic 21.5% |
| Hopi | 0.0 /100 | #341 | Tragic 21.6% |
| Immigrants | Yemen | 0.0 /100 | #342 | Tragic 21.6% |
| Immigrants | Dominican Republic | 0.0 /100 | #343 | Tragic 22.1% |
| Lumbee | 0.0 /100 | #344 | Tragic 22.9% |
| Immigrants | Cabo Verde | 0.0 /100 | #345 | Tragic 23.8% |
| Puerto Ricans | 0.0 /100 | #346 | Tragic 26.0% |
| Yup'ik | 0.0 /100 | #347 | Tragic 32.7% |