Romanian vs Tohono O'odham In Labor Force | Age 20-64
COMPARE
Romanian
Tohono O'odham
In Labor Force | Age 20-64
In Labor Force | Age 20-64 Comparison
Romanians
Tohono O'odham
79.8%
IN LABOR FORCE | AGE 20-64
77.6/ 100
METRIC RATING
148th/ 347
METRIC RANK
70.4%
IN LABOR FORCE | AGE 20-64
0.0/ 100
METRIC RATING
345th/ 347
METRIC RANK
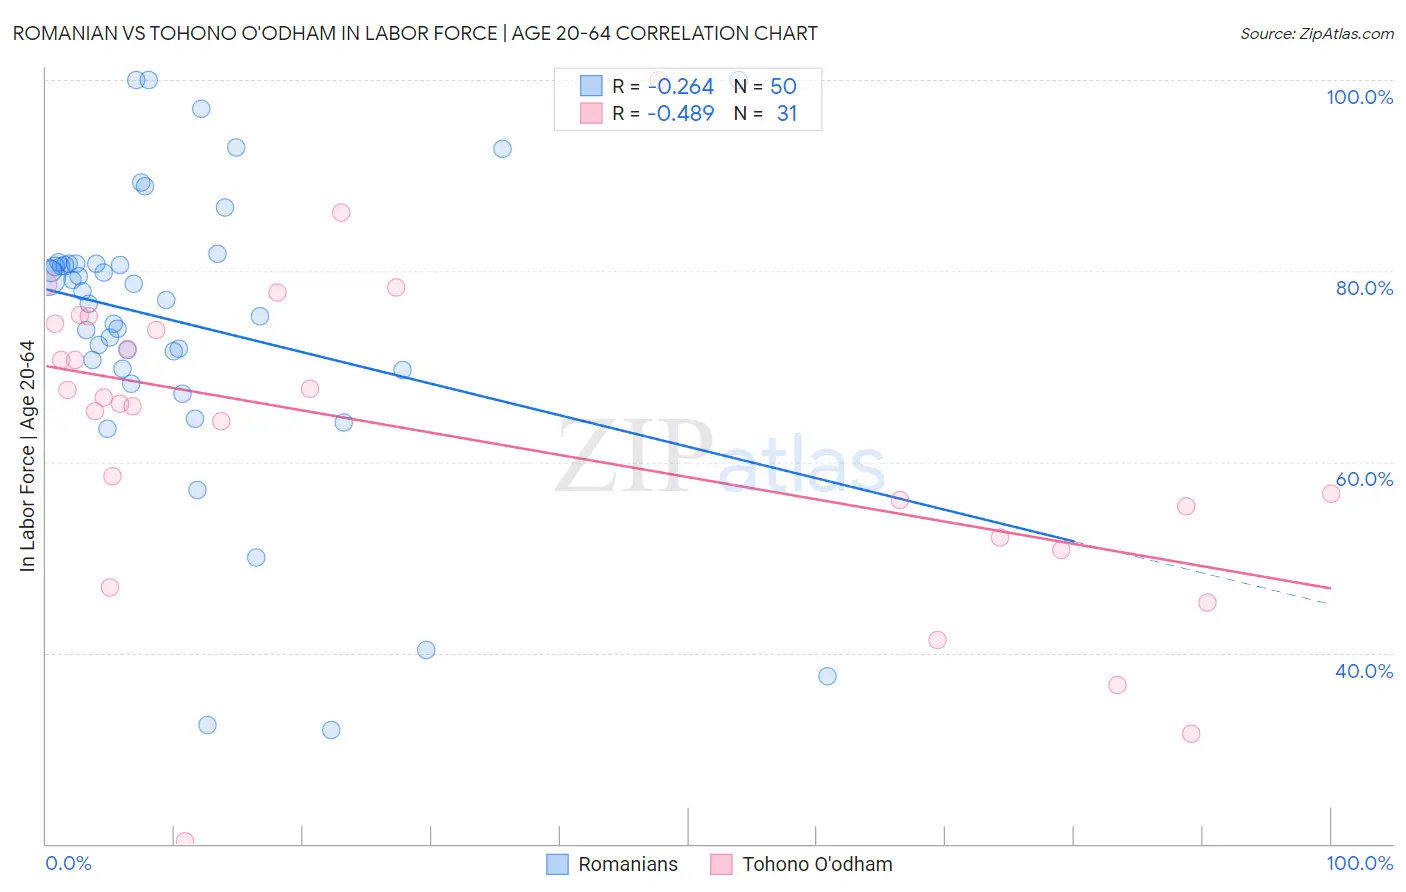
Romanian vs Tohono O'odham In Labor Force | Age 20-64 Correlation Chart
The statistical analysis conducted on geographies consisting of 377,918,924 people shows a weak negative correlation between the proportion of Romanians and labor force participation rate among population between the ages 20 and 64 in the United States with a correlation coefficient (R) of -0.264 and weighted average of 79.8%. Similarly, the statistical analysis conducted on geographies consisting of 58,725,287 people shows a moderate negative correlation between the proportion of Tohono O'odham and labor force participation rate among population between the ages 20 and 64 in the United States with a correlation coefficient (R) of -0.489 and weighted average of 70.4%, a difference of 13.3%.
In Labor Force | Age 20-64 Correlation Summary
| Measurement | Romanian | Tohono O'odham |
| Minimum | 31.9% | 20.2% |
| Maximum | 100.0% | 100.0% |
| Range | 68.1% | 79.8% |
| Mean | 74.5% | 62.8% |
| Median | 77.4% | 66.1% |
| Interquartile 25% (IQ1) | 69.8% | 52.1% |
| Interquartile 75% (IQ3) | 80.7% | 74.5% |
| Interquartile Range (IQR) | 10.9% | 22.4% |
| Standard Deviation (Sample) | 15.5% | 16.8% |
| Standard Deviation (Population) | 15.3% | 16.5% |
Similar Demographics by In Labor Force | Age 20-64
Demographics Similar to Romanians by In Labor Force | Age 20-64
In terms of in labor force | age 20-64, the demographic groups most similar to Romanians are Immigrants from Philippines (79.8%, a difference of 0.0%), Korean (79.8%, a difference of 0.020%), Pakistani (79.8%, a difference of 0.020%), Immigrants from Southern Europe (79.8%, a difference of 0.020%), and Immigrants from Israel (79.8%, a difference of 0.030%).
| Demographics | Rating | Rank | In Labor Force | Age 20-64 |
| Immigrants | Israel | 80.0 /100 | #141 | Good 79.8% |
| Slovaks | 79.9 /100 | #142 | Good 79.8% |
| Immigrants | Sweden | 79.7 /100 | #143 | Good 79.8% |
| Koreans | 79.6 /100 | #144 | Good 79.8% |
| Pakistanis | 79.3 /100 | #145 | Good 79.8% |
| Immigrants | Southern Europe | 78.9 /100 | #146 | Good 79.8% |
| Immigrants | Philippines | 78.0 /100 | #147 | Good 79.8% |
| Romanians | 77.6 /100 | #148 | Good 79.8% |
| Icelanders | 75.1 /100 | #149 | Good 79.7% |
| Costa Ricans | 72.4 /100 | #150 | Good 79.7% |
| Scandinavians | 72.0 /100 | #151 | Good 79.7% |
| Immigrants | Northern Europe | 72.0 /100 | #152 | Good 79.7% |
| Immigrants | Kazakhstan | 69.5 /100 | #153 | Good 79.7% |
| New Zealanders | 69.4 /100 | #154 | Good 79.7% |
| Immigrants | South Africa | 69.2 /100 | #155 | Good 79.7% |
Demographics Similar to Tohono O'odham by In Labor Force | Age 20-64
In terms of in labor force | age 20-64, the demographic groups most similar to Tohono O'odham are Lumbee (70.6%, a difference of 0.33%), Navajo (69.2%, a difference of 1.8%), Hopi (71.7%, a difference of 1.9%), Yuman (71.7%, a difference of 1.9%), and Pima (69.0%, a difference of 2.0%).
| Demographics | Rating | Rank | In Labor Force | Age 20-64 |
| Natives/Alaskans | 0.0 /100 | #333 | Tragic 73.9% |
| Apache | 0.0 /100 | #334 | Tragic 73.7% |
| Ute | 0.0 /100 | #335 | Tragic 73.7% |
| Crow | 0.0 /100 | #336 | Tragic 73.3% |
| Yup'ik | 0.0 /100 | #337 | Tragic 73.2% |
| Puerto Ricans | 0.0 /100 | #338 | Tragic 73.1% |
| Houma | 0.0 /100 | #339 | Tragic 72.7% |
| Pueblo | 0.0 /100 | #340 | Tragic 72.6% |
| Immigrants | Yemen | 0.0 /100 | #341 | Tragic 72.3% |
| Yuman | 0.0 /100 | #342 | Tragic 71.7% |
| Hopi | 0.0 /100 | #343 | Tragic 71.7% |
| Lumbee | 0.0 /100 | #344 | Tragic 70.6% |
| Tohono O'odham | 0.0 /100 | #345 | Tragic 70.4% |
| Navajo | 0.0 /100 | #346 | Tragic 69.2% |
| Pima | 0.0 /100 | #347 | Tragic 69.0% |