Portuguese vs Immigrants from Kuwait Family Poverty
COMPARE
Portuguese
Immigrants from Kuwait
Family Poverty
Family Poverty Comparison
Portuguese
Immigrants from Kuwait
8.4%
FAMILY POVERTY
89.2/ 100
METRIC RATING
129th/ 347
METRIC RANK
8.7%
FAMILY POVERTY
73.6/ 100
METRIC RATING
155th/ 347
METRIC RANK
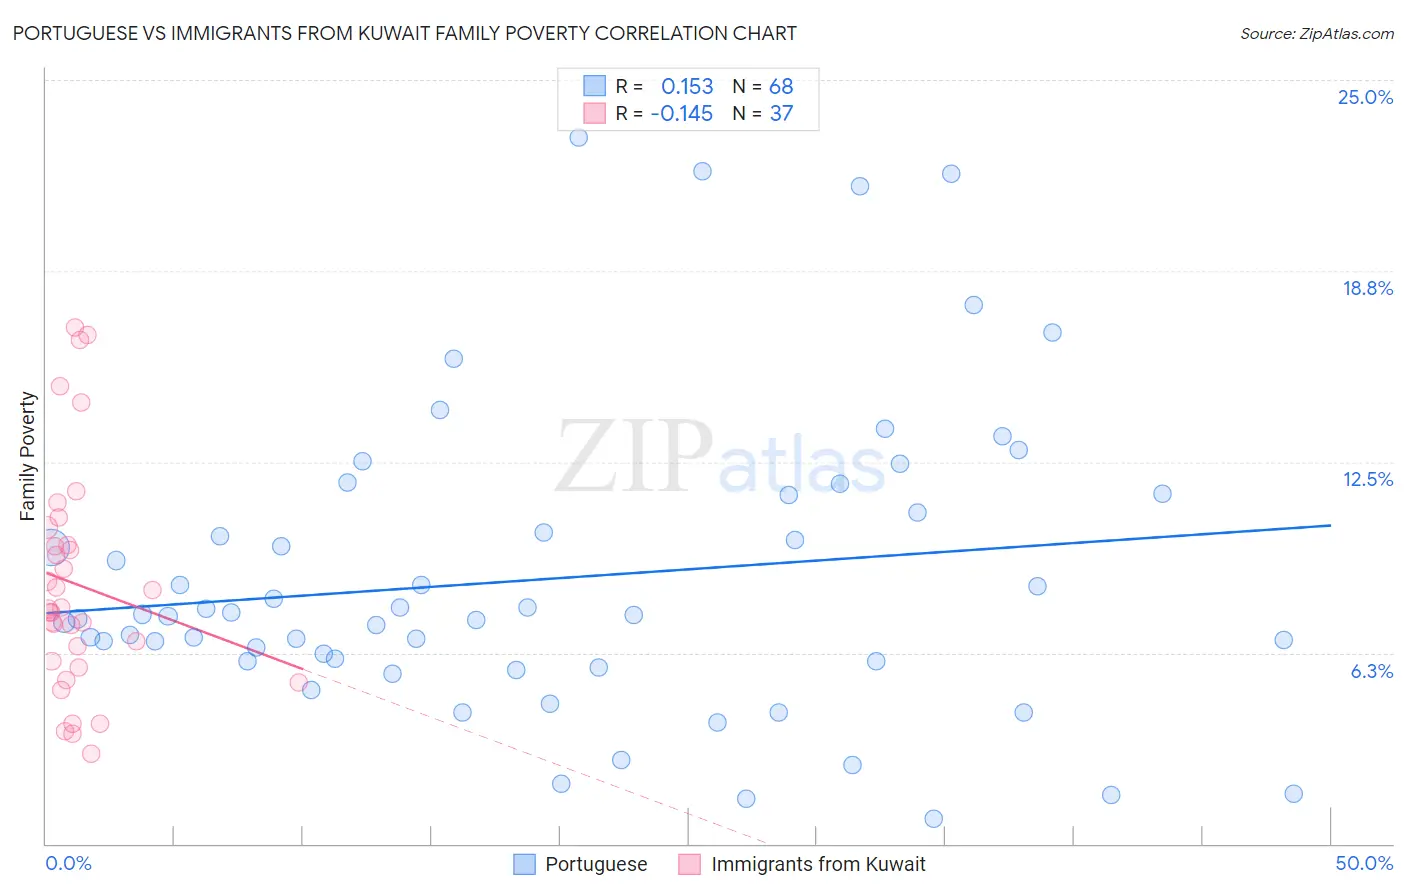
Portuguese vs Immigrants from Kuwait Family Poverty Correlation Chart
The statistical analysis conducted on geographies consisting of 448,364,700 people shows a poor positive correlation between the proportion of Portuguese and poverty level among families in the United States with a correlation coefficient (R) of 0.153 and weighted average of 8.4%. Similarly, the statistical analysis conducted on geographies consisting of 136,830,592 people shows a poor negative correlation between the proportion of Immigrants from Kuwait and poverty level among families in the United States with a correlation coefficient (R) of -0.145 and weighted average of 8.7%, a difference of 3.8%.
Family Poverty Correlation Summary
| Measurement | Portuguese | Immigrants from Kuwait |
| Minimum | 0.81% | 3.0% |
| Maximum | 23.1% | 16.9% |
| Range | 22.3% | 13.9% |
| Mean | 8.7% | 8.5% |
| Median | 7.5% | 7.7% |
| Interquartile 25% (IQ1) | 6.0% | 5.9% |
| Interquartile 75% (IQ3) | 11.1% | 10.1% |
| Interquartile Range (IQR) | 5.1% | 4.2% |
| Standard Deviation (Sample) | 5.0% | 3.7% |
| Standard Deviation (Population) | 4.9% | 3.6% |
Similar Demographics by Family Poverty
Demographics Similar to Portuguese by Family Poverty
In terms of family poverty, the demographic groups most similar to Portuguese are Argentinean (8.4%, a difference of 0.15%), Immigrants from Bosnia and Herzegovina (8.4%, a difference of 0.18%), Puget Sound Salish (8.4%, a difference of 0.19%), Immigrants from Hungary (8.4%, a difference of 0.30%), and Immigrants from Argentina (8.4%, a difference of 0.34%).
| Demographics | Rating | Rank | Family Poverty |
| Paraguayans | 91.2 /100 | #122 | Exceptional 8.3% |
| Palestinians | 91.1 /100 | #123 | Exceptional 8.3% |
| Soviet Union | 90.8 /100 | #124 | Exceptional 8.3% |
| Pakistanis | 90.8 /100 | #125 | Exceptional 8.3% |
| Icelanders | 90.3 /100 | #126 | Exceptional 8.3% |
| Immigrants | Hungary | 89.9 /100 | #127 | Excellent 8.4% |
| Argentineans | 89.6 /100 | #128 | Excellent 8.4% |
| Portuguese | 89.2 /100 | #129 | Excellent 8.4% |
| Immigrants | Bosnia and Herzegovina | 88.6 /100 | #130 | Excellent 8.4% |
| Puget Sound Salish | 88.6 /100 | #131 | Excellent 8.4% |
| Immigrants | Argentina | 88.2 /100 | #132 | Excellent 8.4% |
| Sri Lankans | 86.6 /100 | #133 | Excellent 8.5% |
| Chileans | 86.6 /100 | #134 | Excellent 8.5% |
| Immigrants | Malaysia | 86.5 /100 | #135 | Excellent 8.5% |
| Immigrants | Brazil | 86.3 /100 | #136 | Excellent 8.5% |
Demographics Similar to Immigrants from Kuwait by Family Poverty
In terms of family poverty, the demographic groups most similar to Immigrants from Kuwait are Immigrants from Vietnam (8.7%, a difference of 0.33%), Immigrants from Oceania (8.7%, a difference of 0.40%), Tsimshian (8.8%, a difference of 0.70%), White/Caucasian (8.8%, a difference of 0.74%), and Peruvian (8.8%, a difference of 0.91%).
| Demographics | Rating | Rank | Family Poverty |
| Scotch-Irish | 82.2 /100 | #148 | Excellent 8.6% |
| Mongolians | 80.4 /100 | #149 | Excellent 8.6% |
| Syrians | 80.3 /100 | #150 | Excellent 8.6% |
| Brazilians | 80.1 /100 | #151 | Excellent 8.6% |
| Samoans | 79.8 /100 | #152 | Good 8.6% |
| Immigrants | Spain | 79.1 /100 | #153 | Good 8.6% |
| Immigrants | Vietnam | 75.4 /100 | #154 | Good 8.7% |
| Immigrants | Kuwait | 73.6 /100 | #155 | Good 8.7% |
| Immigrants | Oceania | 71.2 /100 | #156 | Good 8.7% |
| Tsimshian | 69.3 /100 | #157 | Good 8.8% |
| Whites/Caucasians | 69.1 /100 | #158 | Good 8.8% |
| Peruvians | 68.0 /100 | #159 | Good 8.8% |
| Hungarians | 67.2 /100 | #160 | Good 8.8% |
| Immigrants | Northern Africa | 66.9 /100 | #161 | Good 8.8% |
| Ethiopians | 66.3 /100 | #162 | Good 8.8% |