Portuguese vs Immigrants from Costa Rica Family Poverty
COMPARE
Portuguese
Immigrants from Costa Rica
Family Poverty
Family Poverty Comparison
Portuguese
Immigrants from Costa Rica
8.4%
FAMILY POVERTY
89.2/ 100
METRIC RATING
129th/ 347
METRIC RANK
9.4%
FAMILY POVERTY
21.7/ 100
METRIC RATING
200th/ 347
METRIC RANK
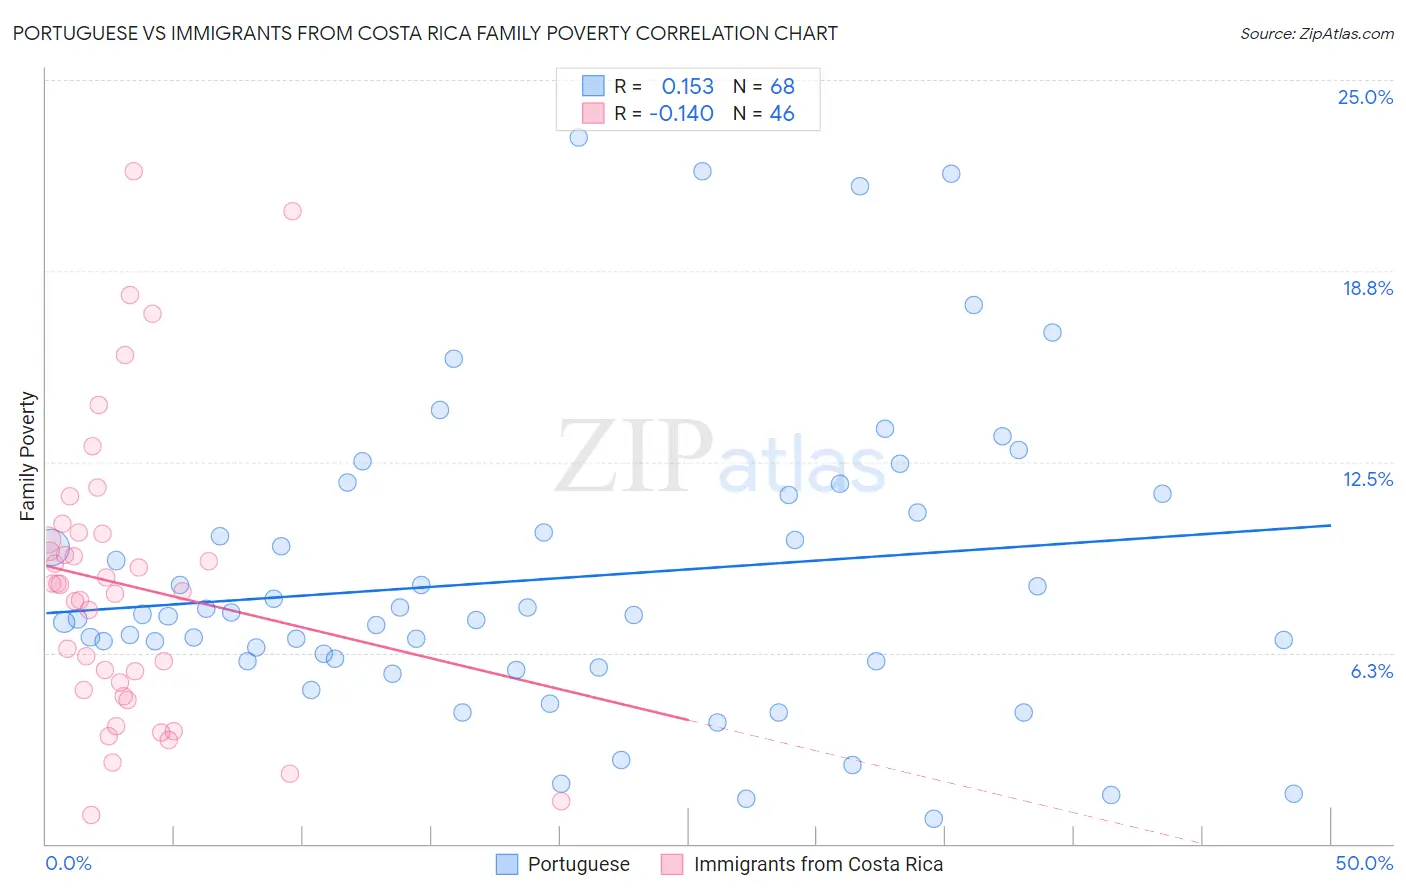
Portuguese vs Immigrants from Costa Rica Family Poverty Correlation Chart
The statistical analysis conducted on geographies consisting of 448,364,700 people shows a poor positive correlation between the proportion of Portuguese and poverty level among families in the United States with a correlation coefficient (R) of 0.153 and weighted average of 8.4%. Similarly, the statistical analysis conducted on geographies consisting of 204,115,485 people shows a poor negative correlation between the proportion of Immigrants from Costa Rica and poverty level among families in the United States with a correlation coefficient (R) of -0.140 and weighted average of 9.4%, a difference of 11.9%.
Family Poverty Correlation Summary
| Measurement | Portuguese | Immigrants from Costa Rica |
| Minimum | 0.81% | 0.92% |
| Maximum | 23.1% | 22.0% |
| Range | 22.3% | 21.1% |
| Mean | 8.7% | 8.5% |
| Median | 7.5% | 8.4% |
| Interquartile 25% (IQ1) | 6.0% | 5.0% |
| Interquartile 75% (IQ3) | 11.1% | 10.2% |
| Interquartile Range (IQR) | 5.1% | 5.1% |
| Standard Deviation (Sample) | 5.0% | 4.8% |
| Standard Deviation (Population) | 4.9% | 4.7% |
Similar Demographics by Family Poverty
Demographics Similar to Portuguese by Family Poverty
In terms of family poverty, the demographic groups most similar to Portuguese are Argentinean (8.4%, a difference of 0.15%), Immigrants from Bosnia and Herzegovina (8.4%, a difference of 0.18%), Puget Sound Salish (8.4%, a difference of 0.19%), Immigrants from Hungary (8.4%, a difference of 0.30%), and Immigrants from Argentina (8.4%, a difference of 0.34%).
| Demographics | Rating | Rank | Family Poverty |
| Paraguayans | 91.2 /100 | #122 | Exceptional 8.3% |
| Palestinians | 91.1 /100 | #123 | Exceptional 8.3% |
| Soviet Union | 90.8 /100 | #124 | Exceptional 8.3% |
| Pakistanis | 90.8 /100 | #125 | Exceptional 8.3% |
| Icelanders | 90.3 /100 | #126 | Exceptional 8.3% |
| Immigrants | Hungary | 89.9 /100 | #127 | Excellent 8.4% |
| Argentineans | 89.6 /100 | #128 | Excellent 8.4% |
| Portuguese | 89.2 /100 | #129 | Excellent 8.4% |
| Immigrants | Bosnia and Herzegovina | 88.6 /100 | #130 | Excellent 8.4% |
| Puget Sound Salish | 88.6 /100 | #131 | Excellent 8.4% |
| Immigrants | Argentina | 88.2 /100 | #132 | Excellent 8.4% |
| Sri Lankans | 86.6 /100 | #133 | Excellent 8.5% |
| Chileans | 86.6 /100 | #134 | Excellent 8.5% |
| Immigrants | Malaysia | 86.5 /100 | #135 | Excellent 8.5% |
| Immigrants | Brazil | 86.3 /100 | #136 | Excellent 8.5% |
Demographics Similar to Immigrants from Costa Rica by Family Poverty
In terms of family poverty, the demographic groups most similar to Immigrants from Costa Rica are Spaniard (9.4%, a difference of 0.19%), Immigrants from Portugal (9.4%, a difference of 0.23%), Immigrants from Sierra Leone (9.4%, a difference of 0.40%), Iraqi (9.3%, a difference of 0.44%), and German Russian (9.4%, a difference of 0.44%).
| Demographics | Rating | Rank | Family Poverty |
| Immigrants | Western Asia | 28.2 /100 | #193 | Fair 9.3% |
| South Americans | 28.1 /100 | #194 | Fair 9.3% |
| Venezuelans | 27.4 /100 | #195 | Fair 9.3% |
| Immigrants | Venezuela | 26.1 /100 | #196 | Fair 9.3% |
| Immigrants | Colombia | 24.4 /100 | #197 | Fair 9.3% |
| Iraqis | 24.2 /100 | #198 | Fair 9.3% |
| Spaniards | 22.8 /100 | #199 | Fair 9.4% |
| Immigrants | Costa Rica | 21.7 /100 | #200 | Fair 9.4% |
| Immigrants | Portugal | 20.5 /100 | #201 | Fair 9.4% |
| Immigrants | Sierra Leone | 19.6 /100 | #202 | Poor 9.4% |
| German Russians | 19.4 /100 | #203 | Poor 9.4% |
| Immigrants | Lebanon | 18.9 /100 | #204 | Poor 9.4% |
| Aleuts | 18.0 /100 | #205 | Poor 9.5% |
| Immigrants | South America | 18.0 /100 | #206 | Poor 9.5% |
| Sierra Leoneans | 15.6 /100 | #207 | Poor 9.5% |