Portuguese vs Lebanese Family Poverty
COMPARE
Portuguese
Lebanese
Family Poverty
Family Poverty Comparison
Portuguese
Lebanese
8.4%
FAMILY POVERTY
89.2/ 100
METRIC RATING
129th/ 347
METRIC RANK
8.9%
FAMILY POVERTY
57.6/ 100
METRIC RATING
171st/ 347
METRIC RANK
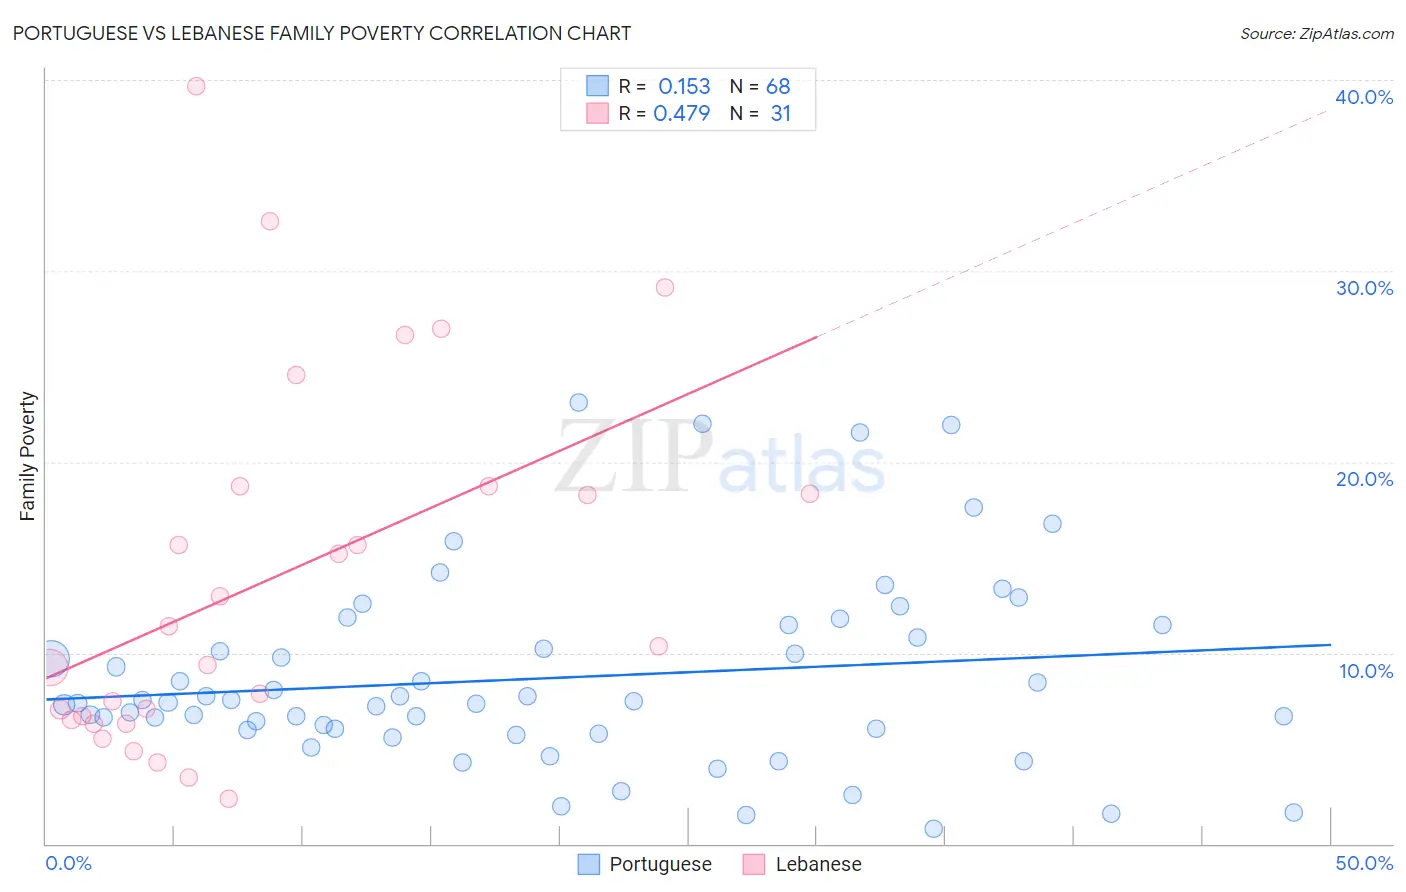
Portuguese vs Lebanese Family Poverty Correlation Chart
The statistical analysis conducted on geographies consisting of 448,364,700 people shows a poor positive correlation between the proportion of Portuguese and poverty level among families in the United States with a correlation coefficient (R) of 0.153 and weighted average of 8.4%. Similarly, the statistical analysis conducted on geographies consisting of 400,253,340 people shows a moderate positive correlation between the proportion of Lebanese and poverty level among families in the United States with a correlation coefficient (R) of 0.479 and weighted average of 8.9%, a difference of 6.3%.
Family Poverty Correlation Summary
| Measurement | Portuguese | Lebanese |
| Minimum | 0.81% | 2.3% |
| Maximum | 23.1% | 39.7% |
| Range | 22.3% | 37.3% |
| Mean | 8.7% | 13.8% |
| Median | 7.5% | 10.4% |
| Interquartile 25% (IQ1) | 6.0% | 6.5% |
| Interquartile 75% (IQ3) | 11.1% | 18.7% |
| Interquartile Range (IQR) | 5.1% | 12.2% |
| Standard Deviation (Sample) | 5.0% | 9.5% |
| Standard Deviation (Population) | 4.9% | 9.4% |
Similar Demographics by Family Poverty
Demographics Similar to Portuguese by Family Poverty
In terms of family poverty, the demographic groups most similar to Portuguese are Argentinean (8.4%, a difference of 0.15%), Immigrants from Bosnia and Herzegovina (8.4%, a difference of 0.18%), Puget Sound Salish (8.4%, a difference of 0.19%), Immigrants from Hungary (8.4%, a difference of 0.30%), and Immigrants from Argentina (8.4%, a difference of 0.34%).
| Demographics | Rating | Rank | Family Poverty |
| Paraguayans | 91.2 /100 | #122 | Exceptional 8.3% |
| Palestinians | 91.1 /100 | #123 | Exceptional 8.3% |
| Soviet Union | 90.8 /100 | #124 | Exceptional 8.3% |
| Pakistanis | 90.8 /100 | #125 | Exceptional 8.3% |
| Icelanders | 90.3 /100 | #126 | Exceptional 8.3% |
| Immigrants | Hungary | 89.9 /100 | #127 | Excellent 8.4% |
| Argentineans | 89.6 /100 | #128 | Excellent 8.4% |
| Portuguese | 89.2 /100 | #129 | Excellent 8.4% |
| Immigrants | Bosnia and Herzegovina | 88.6 /100 | #130 | Excellent 8.4% |
| Puget Sound Salish | 88.6 /100 | #131 | Excellent 8.4% |
| Immigrants | Argentina | 88.2 /100 | #132 | Excellent 8.4% |
| Sri Lankans | 86.6 /100 | #133 | Excellent 8.5% |
| Chileans | 86.6 /100 | #134 | Excellent 8.5% |
| Immigrants | Malaysia | 86.5 /100 | #135 | Excellent 8.5% |
| Immigrants | Brazil | 86.3 /100 | #136 | Excellent 8.5% |
Demographics Similar to Lebanese by Family Poverty
In terms of family poverty, the demographic groups most similar to Lebanese are Immigrants from Peru (8.9%, a difference of 0.010%), Kenyan (8.9%, a difference of 0.080%), Immigrants from Fiji (8.9%, a difference of 0.16%), Immigrants from Chile (8.9%, a difference of 0.27%), and Israeli (8.9%, a difference of 0.62%).
| Demographics | Rating | Rank | Family Poverty |
| Celtics | 64.9 /100 | #164 | Good 8.8% |
| Guamanians/Chamorros | 64.7 /100 | #165 | Good 8.8% |
| Afghans | 63.5 /100 | #166 | Good 8.8% |
| Immigrants | Ethiopia | 62.5 /100 | #167 | Good 8.9% |
| Israelis | 62.1 /100 | #168 | Good 8.9% |
| Immigrants | Chile | 59.6 /100 | #169 | Average 8.9% |
| Kenyans | 58.2 /100 | #170 | Average 8.9% |
| Lebanese | 57.6 /100 | #171 | Average 8.9% |
| Immigrants | Peru | 57.5 /100 | #172 | Average 8.9% |
| Immigrants | Fiji | 56.4 /100 | #173 | Average 8.9% |
| Immigrants | Albania | 50.0 /100 | #174 | Average 9.0% |
| Costa Ricans | 49.3 /100 | #175 | Average 9.0% |
| Immigrants | Syria | 47.5 /100 | #176 | Average 9.0% |
| Hawaiians | 47.2 /100 | #177 | Average 9.0% |
| Immigrants | Cameroon | 47.1 /100 | #178 | Average 9.0% |