Colville vs Immigrants from Kuwait Family Poverty

COMPARE

Colville
Race
Ancestry
AfghanAfricanAlaska NativeAlaskan AthabascanAlbanianAleutAlsatianAmericanApacheArabArapahoArgentineanArmenianAssyrian/Chaldean/SyriacAustralianAustrianBahamianBangladeshiBarbadianBasqueBelgianBelizeanBermudanBhutaneseBlackfeetBolivianBrazilianBritishBritish West IndianBulgarianBurmeseCajunCambodianCanadianCape VerdeanCarpatho RusynCelticCentral AmericanCentral American IndianCherokeeCheyenneChickasawChileanChineseChippewaChoctawColombianColvilleComancheCosta RicanCreeCreekCroatianCrowCubanCypriotCzechCzechoslovakianDanishDelawareDominicanDutchDutch West IndianEastern EuropeanEcuadorianEgyptianEnglishEstonianEthiopianEuropeanFijianFilipinoFinnishFrenchFrench American IndianFrench CanadianGermanGerman RussianGhanaianGreekGuamanian/ChamorroGuatemalanGuyaneseHaitianHmongHonduranHopiHoumaHungarianIcelanderIndian (Asian)IndonesianInupiatIranianIraqiIrishIroquoisIsraeliItalianJamaicanJapaneseJordanianKenyanKiowaKoreanLaotianLatvianLebaneseLiberianLithuanianLumbeeLuxembourgerMacedonianMalaysianMalteseMarshalleseMenomineeMexicanMexican American IndianMongolianMoroccanNative HawaiianNavajoNepaleseNew ZealanderNicaraguanNigerianNorthern EuropeanNorwegianOkinawanOsageOttawaPaiutePakistaniPalestinianPanamanianParaguayanPennsylvania GermanPeruvianPimaPolishPortuguesePotawatomiPuebloPuerto RicanPuget Sound SalishRomanianRussianSalvadoranSamoanScandinavianScotch-IrishScottishSeminoleSenegaleseSerbianShoshoneSierra LeoneanSiouxSlavicSlovakSloveneSomaliSouth AfricanSouth AmericanSouth American IndianSoviet UnionSpaniardSpanishSpanish AmericanSpanish American IndianSri LankanSubsaharan AfricanSudaneseSwedishSwissSyrianTaiwaneseThaiTlingit-HaidaTohono O'OdhamTonganTrinidadian and TobagonianTsimshianTurkishU.S. Virgin IslanderUgandanUkrainianUruguayanUteVenezuelanVietnameseWelshWest IndianYakamaYaquiYugoslavianYumanYup'ikZimbabwean
Immigration
NonimmigrantsImmigrantsAfghanistanAfricaAlbaniaArgentinaArmeniaAsiaAustraliaAustriaBahamasBangladeshBarbadosBelarusBelgiumBelizeBoliviaBosnia and HerzegovinaBrazilBulgariaBurma/MyanmarCabo VerdeCambodiaCameroonCanadaCaribbeanCentral AmericaChileChinaColombiaCongoCosta RicaCroatiaCubaCzechoslovakiaDenmarkDominicaDominican RepublicEastern AfricaEastern AsiaEastern EuropeEcuadorEgyptEl SalvadorEnglandEritreaEthiopiaEuropeFijiFranceGermanyGhanaGreeceGrenadaGuatemalaGuyanaHaitiHondurasHong KongHungaryIndiaIndonesiaIranIraqIrelandIsraelItalyJamaicaJapanJordanKazakhstanKenyaKoreaLaosLatin AmericaLatviaLebanonLiberiaLithuaniaMalaysiaMexicoMicronesiaMiddle AfricaMoldovaMoroccoNepalNetherlandsNicaraguaNigeriaNorth AmericaNorth MacedoniaNorthern AfricaNorthern EuropeNorwayOceaniaPakistanPanamaPeruPhilippinesPolandPortugalRomaniaRussiaSaudi ArabiaScotlandSenegalSerbiaSierra LeoneSingaporeSomaliaSouth AfricaSouth AmericaSouth Central AsiaSouth Eastern AsiaSouthern EuropeSpainSri LankaSt. Vincent and the GrenadinesSudanSwedenSwitzerlandSyriaTaiwanThailandTrinidad and TobagoTurkeyUgandaUkraineUruguayUzbekistanVenezuelaVietnamWest IndiesWestern AfricaWestern AsiaWestern EuropeYemenZaireZimbabweAzores
Immigrants from Kuwait
Race
Ancestry
AfghanAfricanAlaska NativeAlaskan AthabascanAlbanianAleutAlsatianAmericanApacheArabArapahoArgentineanArmenianAssyrian/Chaldean/SyriacAustralianAustrianBahamianBangladeshiBarbadianBasqueBelgianBelizeanBermudanBhutaneseBlackfeetBolivianBrazilianBritishBritish West IndianBulgarianBurmeseCajunCambodianCanadianCape VerdeanCarpatho RusynCelticCentral AmericanCentral American IndianCherokeeCheyenneChickasawChileanChineseChippewaChoctawColombianComancheCosta RicanCreeCreekCroatianCrowCubanCypriotCzechCzechoslovakianDanishDelawareDominicanDutchDutch West IndianEastern EuropeanEcuadorianEgyptianEnglishEstonianEthiopianEuropeanFijianFilipinoFinnishFrenchFrench American IndianFrench CanadianGermanGerman RussianGhanaianGreekGuamanian/ChamorroGuatemalanGuyaneseHaitianHmongHonduranHopiHoumaHungarianIcelanderIndian (Asian)IndonesianInupiatIranianIraqiIrishIroquoisIsraeliItalianJamaicanJapaneseJordanianKenyanKiowaKoreanLaotianLatvianLebaneseLiberianLithuanianLumbeeLuxembourgerMacedonianMalaysianMalteseMarshalleseMenomineeMexicanMexican American IndianMongolianMoroccanNative HawaiianNavajoNepaleseNew ZealanderNicaraguanNigerianNorthern EuropeanNorwegianOkinawanOsageOttawaPaiutePakistaniPalestinianPanamanianParaguayanPennsylvania GermanPeruvianPimaPolishPortuguesePotawatomiPuebloPuerto RicanPuget Sound SalishRomanianRussianSalvadoranSamoanScandinavianScotch-IrishScottishSeminoleSenegaleseSerbianShoshoneSierra LeoneanSiouxSlavicSlovakSloveneSomaliSouth AfricanSouth AmericanSouth American IndianSoviet UnionSpaniardSpanishSpanish AmericanSpanish American IndianSri LankanSubsaharan AfricanSudaneseSwedishSwissSyrianTaiwaneseThaiTlingit-HaidaTohono O'OdhamTonganTrinidadian and TobagonianTsimshianTurkishU.S. Virgin IslanderUgandanUkrainianUruguayanUteVenezuelanVietnameseWelshWest IndianYakamaYaquiYugoslavianYumanYup'ikZimbabwean
Immigration
NonimmigrantsImmigrantsAfghanistanAfricaAlbaniaArgentinaArmeniaAsiaAustraliaAustriaBahamasBangladeshBarbadosBelarusBelgiumBelizeBoliviaBosnia and HerzegovinaBrazilBulgariaBurma/MyanmarCabo VerdeCambodiaCameroonCanadaCaribbeanCentral AmericaChileChinaColombiaCongoCosta RicaCroatiaCubaCzechoslovakiaDenmarkDominicaDominican RepublicEastern AfricaEastern AsiaEastern EuropeEcuadorEgyptEl SalvadorEnglandEritreaEthiopiaEuropeFijiFranceGermanyGhanaGreeceGrenadaGuatemalaGuyanaHaitiHondurasHong KongHungaryIndiaIndonesiaIranIraqIrelandIsraelItalyJamaicaJapanJordanKazakhstanKenyaKoreaKuwaitLaosLatin AmericaLatviaLebanonLiberiaLithuaniaMalaysiaMexicoMicronesiaMiddle AfricaMoldovaMoroccoNepalNetherlandsNicaraguaNigeriaNorth AmericaNorth MacedoniaNorthern AfricaNorthern EuropeNorwayOceaniaPakistanPanamaPeruPhilippinesPolandPortugalRomaniaRussiaSaudi ArabiaScotlandSenegalSerbiaSierra LeoneSingaporeSomaliaSouth AfricaSouth AmericaSouth Central AsiaSouth Eastern AsiaSouthern EuropeSpainSri LankaSt. Vincent and the GrenadinesSudanSwedenSwitzerlandSyriaTaiwanThailandTrinidad and TobagoTurkeyUgandaUkraineUruguayUzbekistanVenezuelaVietnamWest IndiesWestern AfricaWestern AsiaWestern EuropeYemenZaireZimbabweAzores
Family Poverty
Income
Poverty
Unemployment
Labor Participation
Family Structure
Vehicle Availability
Education Level
Disability

Family Poverty Comparison

Colville

Immigrants from Kuwait

Tragic
Good
13.0%
FAMILY POVERTY
0.0/ 100
METRIC RATING
326th/ 347
METRIC RANK
8.7%
FAMILY POVERTY
73.6/ 100
METRIC RATING
155th/ 347
METRIC RANK

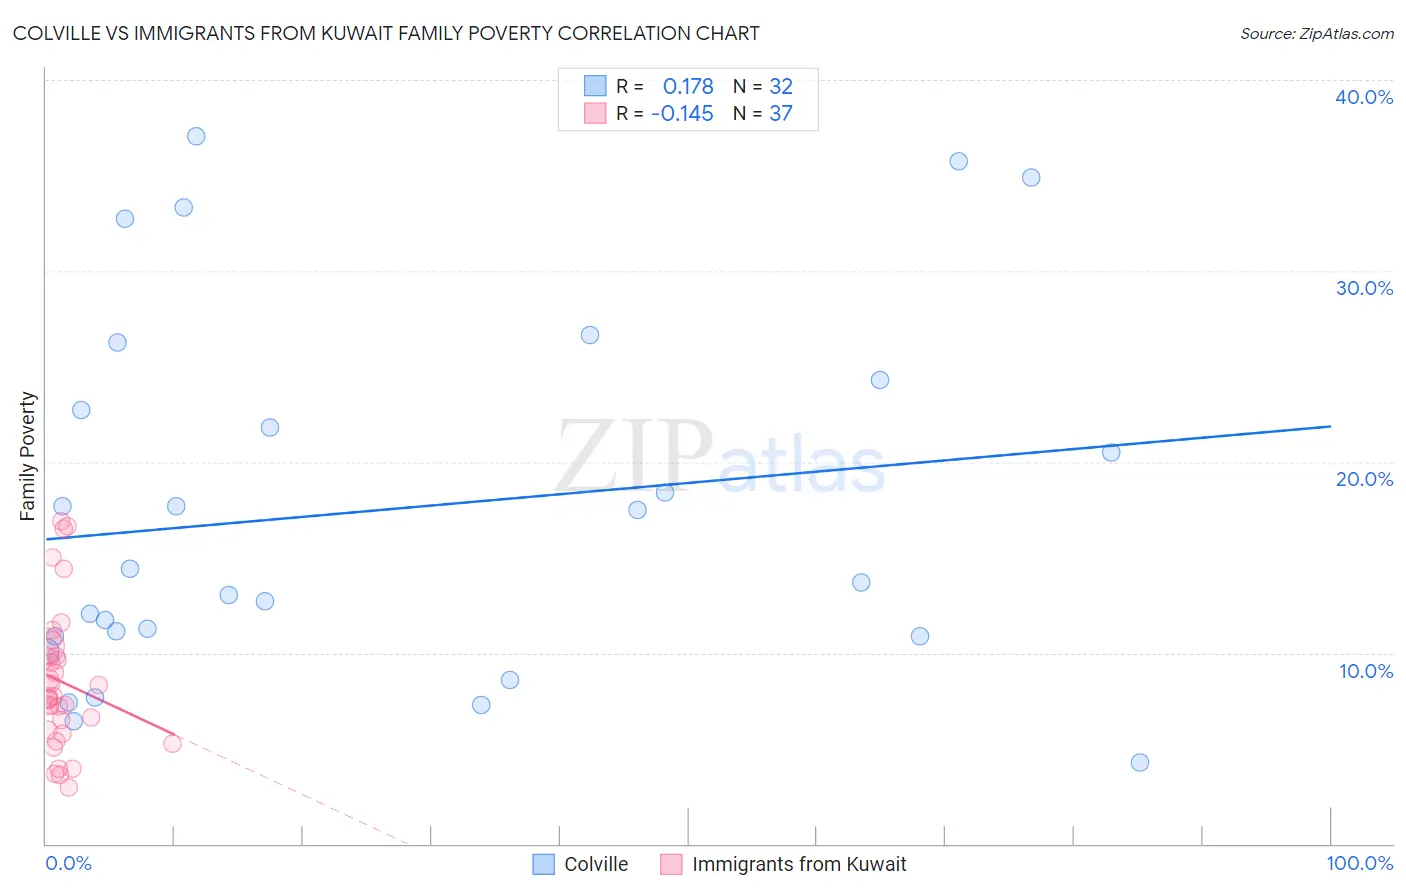
Colville vs Immigrants from Kuwait Family Poverty Correlation Chart

The statistical analysis conducted on geographies consisting of 34,676,230 people shows a poor positive correlation between the proportion of Colville and poverty level among families in the United States with a correlation coefficient (R) of 0.178 and weighted average of 13.0%. Similarly, the statistical analysis conducted on geographies consisting of 136,830,592 people shows a poor negative correlation between the proportion of Immigrants from Kuwait and poverty level among families in the United States with a correlation coefficient (R) of -0.145 and weighted average of 8.7%, a difference of 49.4%.
Colville vs Immigrants from Kuwait Family Poverty

Family Poverty Correlation Summary

MeasurementColvilleImmigrants from Kuwait
Minimum4.3%3.0%
Maximum37.1%16.9%
Range32.8%13.9%
Mean17.5%8.5%
Median14.0%7.7%
Interquartile 25% (IQ1)10.9%5.9%
Interquartile 75% (IQ3)23.5%10.1%
Interquartile Range (IQR)12.6%4.2%
Standard Deviation (Sample)9.5%3.7%
Standard Deviation (Population)9.3%3.6%

Similar Demographics by Family Poverty

Demographics Similar to Colville by Family Poverty

In terms of family poverty, the demographic groups most similar to Colville are Paiute (13.0%, a difference of 0.060%), Yakama (13.1%, a difference of 0.68%), Immigrants from Dominica (12.7%, a difference of 2.0%), Menominee (12.7%, a difference of 2.1%), and Central American Indian (13.3%, a difference of 2.4%).
DemographicsRating | RankFamily Poverty
British West Indians
0.0
/100
|
#319
Tragic
12.4%
Inupiat
0.0
/100
|
#320
Tragic
12.5%
Arapaho
0.0
/100
|
#321
Tragic
12.7%
Immigrants | Honduras
0.0
/100
|
#322
Tragic
12.7%
Menominee
0.0
/100
|
#323
Tragic
12.7%
Immigrants | Dominica
0.0
/100
|
#324
Tragic
12.7%
Paiute
0.0
/100
|
#325
Tragic
13.0%
Colville
0.0
/100
|
#326
Tragic
13.0%
Yakama
0.0
/100
|
#327
Tragic
13.1%
Central American Indians
0.0
/100
|
#328
Tragic
13.3%
Blacks/African Americans
0.0
/100
|
#329
Tragic
13.3%
Natives/Alaskans
0.0
/100
|
#330
Tragic
14.3%
Cheyenne
0.0
/100
|
#331
Tragic
14.3%
Dominicans
0.0
/100
|
#332
Tragic
14.3%
Immigrants | Dominican Republic
0.0
/100
|
#333
Tragic
14.4%

Demographics Similar to Immigrants from Kuwait by Family Poverty

In terms of family poverty, the demographic groups most similar to Immigrants from Kuwait are Immigrants from Vietnam (8.7%, a difference of 0.33%), Immigrants from Oceania (8.7%, a difference of 0.40%), Tsimshian (8.8%, a difference of 0.70%), White/Caucasian (8.8%, a difference of 0.74%), and Peruvian (8.8%, a difference of 0.91%).
DemographicsRating | RankFamily Poverty
Scotch-Irish
82.2
/100
|
#148
Excellent
8.6%
Mongolians
80.4
/100
|
#149
Excellent
8.6%
Syrians
80.3
/100
|
#150
Excellent
8.6%
Brazilians
80.1
/100
|
#151
Excellent
8.6%
Samoans
79.8
/100
|
#152
Good
8.6%
Immigrants | Spain
79.1
/100
|
#153
Good
8.6%
Immigrants | Vietnam
75.4
/100
|
#154
Good
8.7%
Immigrants | Kuwait
73.6
/100
|
#155
Good
8.7%
Immigrants | Oceania
71.2
/100
|
#156
Good
8.7%
Tsimshian
69.3
/100
|
#157
Good
8.8%
Whites/Caucasians
69.1
/100
|
#158
Good
8.8%
Peruvians
68.0
/100
|
#159
Good
8.8%
Hungarians
67.2
/100
|
#160
Good
8.8%
Immigrants | Northern Africa
66.9
/100
|
#161
Good
8.8%
Ethiopians
66.3
/100
|
#162
Good
8.8%