Portuguese vs African Family Poverty
COMPARE
Portuguese
African
Family Poverty
Family Poverty Comparison
Portuguese
Africans
8.4%
FAMILY POVERTY
89.2/ 100
METRIC RATING
129th/ 347
METRIC RANK
11.8%
FAMILY POVERTY
0.0/ 100
METRIC RATING
303rd/ 347
METRIC RANK
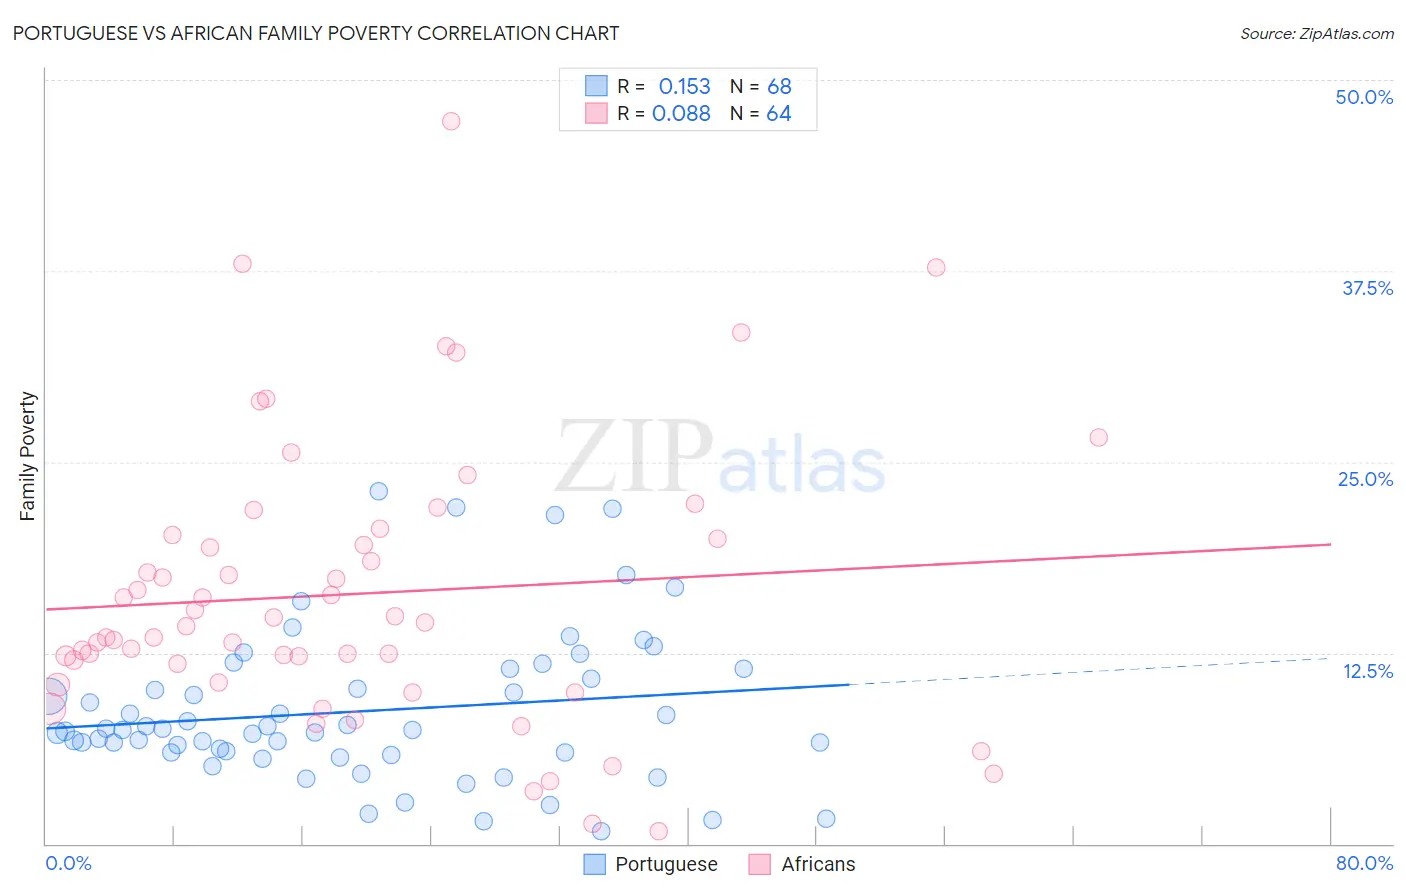
Portuguese vs African Family Poverty Correlation Chart
The statistical analysis conducted on geographies consisting of 448,364,700 people shows a poor positive correlation between the proportion of Portuguese and poverty level among families in the United States with a correlation coefficient (R) of 0.153 and weighted average of 8.4%. Similarly, the statistical analysis conducted on geographies consisting of 468,652,941 people shows a slight positive correlation between the proportion of Africans and poverty level among families in the United States with a correlation coefficient (R) of 0.088 and weighted average of 11.8%, a difference of 40.4%.
Family Poverty Correlation Summary
| Measurement | Portuguese | African |
| Minimum | 0.81% | 0.78% |
| Maximum | 23.1% | 47.3% |
| Range | 22.3% | 46.5% |
| Mean | 8.7% | 16.4% |
| Median | 7.5% | 14.4% |
| Interquartile 25% (IQ1) | 6.0% | 11.2% |
| Interquartile 75% (IQ3) | 11.1% | 20.1% |
| Interquartile Range (IQR) | 5.1% | 9.0% |
| Standard Deviation (Sample) | 5.0% | 9.2% |
| Standard Deviation (Population) | 4.9% | 9.1% |
Similar Demographics by Family Poverty
Demographics Similar to Portuguese by Family Poverty
In terms of family poverty, the demographic groups most similar to Portuguese are Argentinean (8.4%, a difference of 0.15%), Immigrants from Bosnia and Herzegovina (8.4%, a difference of 0.18%), Puget Sound Salish (8.4%, a difference of 0.19%), Immigrants from Hungary (8.4%, a difference of 0.30%), and Immigrants from Argentina (8.4%, a difference of 0.34%).
| Demographics | Rating | Rank | Family Poverty |
| Paraguayans | 91.2 /100 | #122 | Exceptional 8.3% |
| Palestinians | 91.1 /100 | #123 | Exceptional 8.3% |
| Soviet Union | 90.8 /100 | #124 | Exceptional 8.3% |
| Pakistanis | 90.8 /100 | #125 | Exceptional 8.3% |
| Icelanders | 90.3 /100 | #126 | Exceptional 8.3% |
| Immigrants | Hungary | 89.9 /100 | #127 | Excellent 8.4% |
| Argentineans | 89.6 /100 | #128 | Excellent 8.4% |
| Portuguese | 89.2 /100 | #129 | Excellent 8.4% |
| Immigrants | Bosnia and Herzegovina | 88.6 /100 | #130 | Excellent 8.4% |
| Puget Sound Salish | 88.6 /100 | #131 | Excellent 8.4% |
| Immigrants | Argentina | 88.2 /100 | #132 | Excellent 8.4% |
| Sri Lankans | 86.6 /100 | #133 | Excellent 8.5% |
| Chileans | 86.6 /100 | #134 | Excellent 8.5% |
| Immigrants | Malaysia | 86.5 /100 | #135 | Excellent 8.5% |
| Immigrants | Brazil | 86.3 /100 | #136 | Excellent 8.5% |
Demographics Similar to Africans by Family Poverty
In terms of family poverty, the demographic groups most similar to Africans are Immigrants from Latin America (11.8%, a difference of 0.19%), Mexican (11.8%, a difference of 0.37%), Guatemalan (11.7%, a difference of 0.50%), Bahamian (11.7%, a difference of 0.54%), and Immigrants from Bangladesh (11.7%, a difference of 0.80%).
| Demographics | Rating | Rank | Family Poverty |
| Choctaw | 0.0 /100 | #296 | Tragic 11.6% |
| Creek | 0.0 /100 | #297 | Tragic 11.7% |
| Immigrants | Senegal | 0.0 /100 | #298 | Tragic 11.7% |
| Dutch West Indians | 0.0 /100 | #299 | Tragic 11.7% |
| Immigrants | Bangladesh | 0.0 /100 | #300 | Tragic 11.7% |
| Bahamians | 0.0 /100 | #301 | Tragic 11.7% |
| Guatemalans | 0.0 /100 | #302 | Tragic 11.7% |
| Africans | 0.0 /100 | #303 | Tragic 11.8% |
| Immigrants | Latin America | 0.0 /100 | #304 | Tragic 11.8% |
| Mexicans | 0.0 /100 | #305 | Tragic 11.8% |
| Cajuns | 0.0 /100 | #306 | Tragic 11.9% |
| Immigrants | Congo | 0.0 /100 | #307 | Tragic 11.9% |
| Seminole | 0.0 /100 | #308 | Tragic 11.9% |
| Hispanics or Latinos | 0.0 /100 | #309 | Tragic 12.0% |
| Immigrants | Guatemala | 0.0 /100 | #310 | Tragic 12.0% |