Portuguese vs Immigrants from Mexico Family Poverty
COMPARE
Portuguese
Immigrants from Mexico
Family Poverty
Family Poverty Comparison
Portuguese
Immigrants from Mexico
8.4%
FAMILY POVERTY
89.2/ 100
METRIC RATING
129th/ 347
METRIC RANK
12.3%
FAMILY POVERTY
0.0/ 100
METRIC RATING
315th/ 347
METRIC RANK
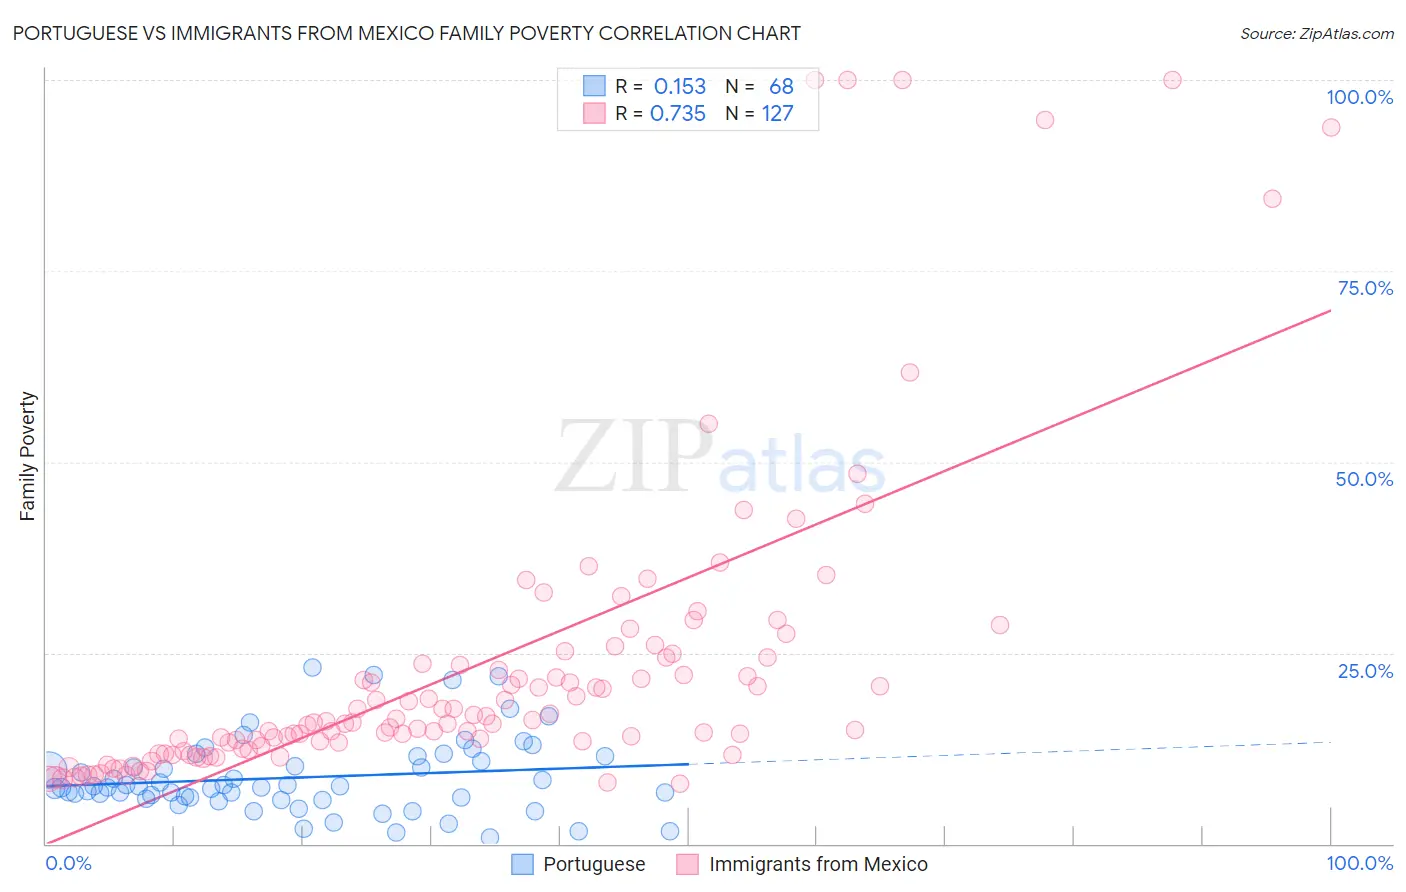
Portuguese vs Immigrants from Mexico Family Poverty Correlation Chart
The statistical analysis conducted on geographies consisting of 448,364,700 people shows a poor positive correlation between the proportion of Portuguese and poverty level among families in the United States with a correlation coefficient (R) of 0.153 and weighted average of 8.4%. Similarly, the statistical analysis conducted on geographies consisting of 511,802,824 people shows a strong positive correlation between the proportion of Immigrants from Mexico and poverty level among families in the United States with a correlation coefficient (R) of 0.735 and weighted average of 12.3%, a difference of 46.4%.
Family Poverty Correlation Summary
| Measurement | Portuguese | Immigrants from Mexico |
| Minimum | 0.81% | 7.9% |
| Maximum | 23.1% | 100.0% |
| Range | 22.3% | 92.1% |
| Mean | 8.7% | 23.1% |
| Median | 7.5% | 15.9% |
| Interquartile 25% (IQ1) | 6.0% | 12.5% |
| Interquartile 75% (IQ3) | 11.1% | 24.4% |
| Interquartile Range (IQR) | 5.1% | 11.9% |
| Standard Deviation (Sample) | 5.0% | 20.2% |
| Standard Deviation (Population) | 4.9% | 20.1% |
Similar Demographics by Family Poverty
Demographics Similar to Portuguese by Family Poverty
In terms of family poverty, the demographic groups most similar to Portuguese are Argentinean (8.4%, a difference of 0.15%), Immigrants from Bosnia and Herzegovina (8.4%, a difference of 0.18%), Puget Sound Salish (8.4%, a difference of 0.19%), Immigrants from Hungary (8.4%, a difference of 0.30%), and Immigrants from Argentina (8.4%, a difference of 0.34%).
| Demographics | Rating | Rank | Family Poverty |
| Paraguayans | 91.2 /100 | #122 | Exceptional 8.3% |
| Palestinians | 91.1 /100 | #123 | Exceptional 8.3% |
| Soviet Union | 90.8 /100 | #124 | Exceptional 8.3% |
| Pakistanis | 90.8 /100 | #125 | Exceptional 8.3% |
| Icelanders | 90.3 /100 | #126 | Exceptional 8.3% |
| Immigrants | Hungary | 89.9 /100 | #127 | Excellent 8.4% |
| Argentineans | 89.6 /100 | #128 | Excellent 8.4% |
| Portuguese | 89.2 /100 | #129 | Excellent 8.4% |
| Immigrants | Bosnia and Herzegovina | 88.6 /100 | #130 | Excellent 8.4% |
| Puget Sound Salish | 88.6 /100 | #131 | Excellent 8.4% |
| Immigrants | Argentina | 88.2 /100 | #132 | Excellent 8.4% |
| Sri Lankans | 86.6 /100 | #133 | Excellent 8.5% |
| Chileans | 86.6 /100 | #134 | Excellent 8.5% |
| Immigrants | Malaysia | 86.5 /100 | #135 | Excellent 8.5% |
| Immigrants | Brazil | 86.3 /100 | #136 | Excellent 8.5% |
Demographics Similar to Immigrants from Mexico by Family Poverty
In terms of family poverty, the demographic groups most similar to Immigrants from Mexico are Kiowa (12.2%, a difference of 0.26%), Honduran (12.4%, a difference of 0.74%), Immigrants from Caribbean (12.2%, a difference of 0.76%), Immigrants from Grenada (12.4%, a difference of 0.96%), and U.S. Virgin Islander (12.4%, a difference of 0.96%).
| Demographics | Rating | Rank | Family Poverty |
| Seminole | 0.0 /100 | #308 | Tragic 11.9% |
| Hispanics or Latinos | 0.0 /100 | #309 | Tragic 12.0% |
| Immigrants | Guatemala | 0.0 /100 | #310 | Tragic 12.0% |
| Ute | 0.0 /100 | #311 | Tragic 12.1% |
| Immigrants | Central America | 0.0 /100 | #312 | Tragic 12.1% |
| Immigrants | Caribbean | 0.0 /100 | #313 | Tragic 12.2% |
| Kiowa | 0.0 /100 | #314 | Tragic 12.2% |
| Immigrants | Mexico | 0.0 /100 | #315 | Tragic 12.3% |
| Hondurans | 0.0 /100 | #316 | Tragic 12.4% |
| Immigrants | Grenada | 0.0 /100 | #317 | Tragic 12.4% |
| U.S. Virgin Islanders | 0.0 /100 | #318 | Tragic 12.4% |
| British West Indians | 0.0 /100 | #319 | Tragic 12.4% |
| Inupiat | 0.0 /100 | #320 | Tragic 12.5% |
| Arapaho | 0.0 /100 | #321 | Tragic 12.7% |
| Immigrants | Honduras | 0.0 /100 | #322 | Tragic 12.7% |