Portuguese vs Carpatho Rusyn Family Poverty
COMPARE
Portuguese
Carpatho Rusyn
Family Poverty
Family Poverty Comparison
Portuguese
Carpatho Rusyns
8.4%
FAMILY POVERTY
89.2/ 100
METRIC RATING
129th/ 347
METRIC RANK
7.5%
FAMILY POVERTY
99.3/ 100
METRIC RATING
39th/ 347
METRIC RANK
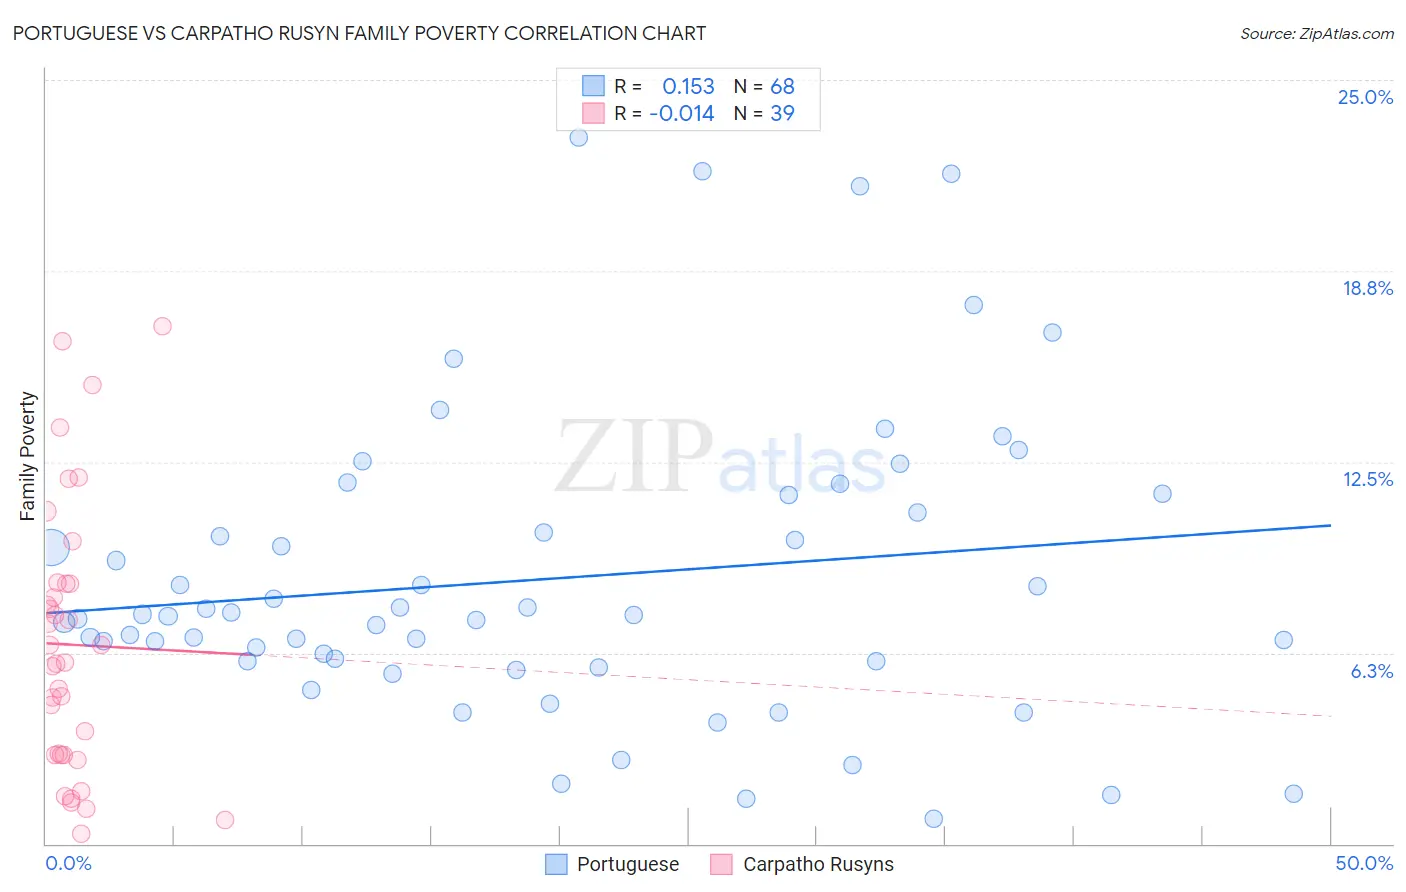
Portuguese vs Carpatho Rusyn Family Poverty Correlation Chart
The statistical analysis conducted on geographies consisting of 448,364,700 people shows a poor positive correlation between the proportion of Portuguese and poverty level among families in the United States with a correlation coefficient (R) of 0.153 and weighted average of 8.4%. Similarly, the statistical analysis conducted on geographies consisting of 58,816,515 people shows no correlation between the proportion of Carpatho Rusyns and poverty level among families in the United States with a correlation coefficient (R) of -0.014 and weighted average of 7.5%, a difference of 11.2%.
Family Poverty Correlation Summary
| Measurement | Portuguese | Carpatho Rusyn |
| Minimum | 0.81% | 0.31% |
| Maximum | 23.1% | 16.9% |
| Range | 22.3% | 16.6% |
| Mean | 8.7% | 6.5% |
| Median | 7.5% | 5.9% |
| Interquartile 25% (IQ1) | 6.0% | 2.9% |
| Interquartile 75% (IQ3) | 11.1% | 8.5% |
| Interquartile Range (IQR) | 5.1% | 5.6% |
| Standard Deviation (Sample) | 5.0% | 4.4% |
| Standard Deviation (Population) | 4.9% | 4.3% |
Similar Demographics by Family Poverty
Demographics Similar to Portuguese by Family Poverty
In terms of family poverty, the demographic groups most similar to Portuguese are Argentinean (8.4%, a difference of 0.15%), Immigrants from Bosnia and Herzegovina (8.4%, a difference of 0.18%), Puget Sound Salish (8.4%, a difference of 0.19%), Immigrants from Hungary (8.4%, a difference of 0.30%), and Immigrants from Argentina (8.4%, a difference of 0.34%).
| Demographics | Rating | Rank | Family Poverty |
| Paraguayans | 91.2 /100 | #122 | Exceptional 8.3% |
| Palestinians | 91.1 /100 | #123 | Exceptional 8.3% |
| Soviet Union | 90.8 /100 | #124 | Exceptional 8.3% |
| Pakistanis | 90.8 /100 | #125 | Exceptional 8.3% |
| Icelanders | 90.3 /100 | #126 | Exceptional 8.3% |
| Immigrants | Hungary | 89.9 /100 | #127 | Excellent 8.4% |
| Argentineans | 89.6 /100 | #128 | Excellent 8.4% |
| Portuguese | 89.2 /100 | #129 | Excellent 8.4% |
| Immigrants | Bosnia and Herzegovina | 88.6 /100 | #130 | Excellent 8.4% |
| Puget Sound Salish | 88.6 /100 | #131 | Excellent 8.4% |
| Immigrants | Argentina | 88.2 /100 | #132 | Excellent 8.4% |
| Sri Lankans | 86.6 /100 | #133 | Excellent 8.5% |
| Chileans | 86.6 /100 | #134 | Excellent 8.5% |
| Immigrants | Malaysia | 86.5 /100 | #135 | Excellent 8.5% |
| Immigrants | Brazil | 86.3 /100 | #136 | Excellent 8.5% |
Demographics Similar to Carpatho Rusyns by Family Poverty
In terms of family poverty, the demographic groups most similar to Carpatho Rusyns are Slovene (7.5%, a difference of 0.040%), Bolivian (7.5%, a difference of 0.060%), Estonian (7.5%, a difference of 0.31%), Immigrants from Australia (7.6%, a difference of 0.34%), and Turkish (7.5%, a difference of 0.47%).
| Demographics | Rating | Rank | Family Poverty |
| Poles | 99.5 /100 | #32 | Exceptional 7.4% |
| Immigrants | Japan | 99.5 /100 | #33 | Exceptional 7.4% |
| Russians | 99.5 /100 | #34 | Exceptional 7.5% |
| Greeks | 99.4 /100 | #35 | Exceptional 7.5% |
| Turks | 99.4 /100 | #36 | Exceptional 7.5% |
| Estonians | 99.4 /100 | #37 | Exceptional 7.5% |
| Bolivians | 99.3 /100 | #38 | Exceptional 7.5% |
| Carpatho Rusyns | 99.3 /100 | #39 | Exceptional 7.5% |
| Slovenes | 99.3 /100 | #40 | Exceptional 7.5% |
| Immigrants | Australia | 99.2 /100 | #41 | Exceptional 7.6% |
| Scandinavians | 99.1 /100 | #42 | Exceptional 7.6% |
| Immigrants | Austria | 99.1 /100 | #43 | Exceptional 7.6% |
| Germans | 99.0 /100 | #44 | Exceptional 7.7% |
| Okinawans | 98.9 /100 | #45 | Exceptional 7.7% |
| Tongans | 98.9 /100 | #46 | Exceptional 7.7% |