Peruvian vs Immigrants from Oceania Receiving Food Stamps
COMPARE
Peruvian
Immigrants from Oceania
Receiving Food Stamps
Receiving Food Stamps Comparison
Peruvians
Immigrants from Oceania
11.7%
RECEIVING FOOD STAMPS
49.3/ 100
METRIC RATING
176th/ 347
METRIC RANK
11.4%
RECEIVING FOOD STAMPS
70.4/ 100
METRIC RATING
159th/ 347
METRIC RANK
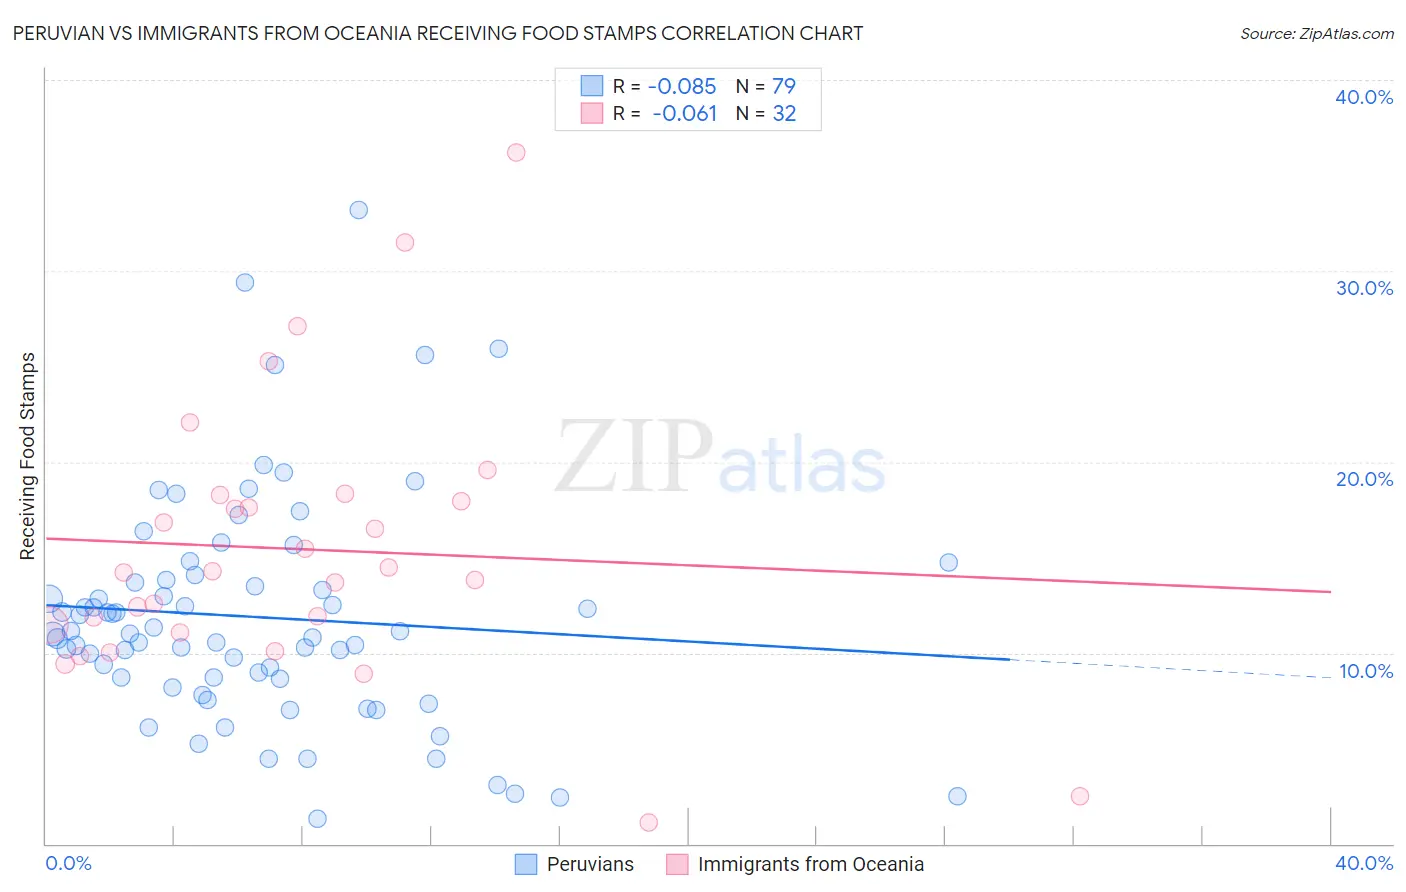
Peruvian vs Immigrants from Oceania Receiving Food Stamps Correlation Chart
The statistical analysis conducted on geographies consisting of 362,284,397 people shows a slight negative correlation between the proportion of Peruvians and percentage of population receiving government assistance and/or food stamps in the United States with a correlation coefficient (R) of -0.085 and weighted average of 11.7%. Similarly, the statistical analysis conducted on geographies consisting of 304,706,575 people shows a slight negative correlation between the proportion of Immigrants from Oceania and percentage of population receiving government assistance and/or food stamps in the United States with a correlation coefficient (R) of -0.061 and weighted average of 11.4%, a difference of 3.2%.
Receiving Food Stamps Correlation Summary
| Measurement | Peruvian | Immigrants from Oceania |
| Minimum | 1.3% | 1.1% |
| Maximum | 33.2% | 36.2% |
| Range | 31.9% | 35.1% |
| Mean | 11.9% | 15.4% |
| Median | 11.0% | 14.2% |
| Interquartile 25% (IQ1) | 8.7% | 11.2% |
| Interquartile 75% (IQ3) | 13.8% | 18.1% |
| Interquartile Range (IQR) | 5.1% | 6.9% |
| Standard Deviation (Sample) | 6.0% | 7.3% |
| Standard Deviation (Population) | 5.9% | 7.2% |
Demographics Similar to Peruvians and Immigrants from Oceania by Receiving Food Stamps
In terms of receiving food stamps, the demographic groups most similar to Peruvians are Osage (11.7%, a difference of 0.070%), Immigrants from Eritrea (11.7%, a difference of 0.10%), Immigrants from Ukraine (11.8%, a difference of 0.13%), Immigrants from Syria (11.7%, a difference of 0.58%), and Guamanian/Chamorro (11.7%, a difference of 0.69%). Similarly, the demographic groups most similar to Immigrants from Oceania are French Canadian (11.4%, a difference of 0.16%), Pennsylvania German (11.4%, a difference of 0.34%), Immigrants from Bosnia and Herzegovina (11.3%, a difference of 0.39%), Alsatian (11.4%, a difference of 0.41%), and Immigrants from Southern Europe (11.5%, a difference of 0.78%).
| Demographics | Rating | Rank | Receiving Food Stamps |
| Immigrants | Lebanon | 75.2 /100 | #157 | Good 11.3% |
| Immigrants | Bosnia and Herzegovina | 72.6 /100 | #158 | Good 11.3% |
| Immigrants | Oceania | 70.4 /100 | #159 | Good 11.4% |
| French Canadians | 69.5 /100 | #160 | Good 11.4% |
| Pennsylvania Germans | 68.4 /100 | #161 | Good 11.4% |
| Alsatians | 68.0 /100 | #162 | Good 11.4% |
| Immigrants | Southern Europe | 65.8 /100 | #163 | Good 11.5% |
| Immigrants | Chile | 65.0 /100 | #164 | Good 11.5% |
| Arabs | 64.7 /100 | #165 | Good 11.5% |
| Immigrants | Belarus | 62.8 /100 | #166 | Good 11.5% |
| Kenyans | 60.2 /100 | #167 | Good 11.6% |
| Tlingit-Haida | 59.1 /100 | #168 | Average 11.6% |
| Immigrants | Eastern Africa | 58.3 /100 | #169 | Average 11.6% |
| Costa Ricans | 57.9 /100 | #170 | Average 11.6% |
| Immigrants | Western Asia | 56.4 /100 | #171 | Average 11.6% |
| Guamanians/Chamorros | 54.2 /100 | #172 | Average 11.7% |
| Immigrants | Syria | 53.4 /100 | #173 | Average 11.7% |
| Immigrants | Eritrea | 50.0 /100 | #174 | Average 11.7% |
| Osage | 49.8 /100 | #175 | Average 11.7% |
| Peruvians | 49.3 /100 | #176 | Average 11.7% |
| Immigrants | Ukraine | 48.4 /100 | #177 | Average 11.8% |