Peruvian vs Immigrants from Belize Receiving Food Stamps
COMPARE
Peruvian
Immigrants from Belize
Receiving Food Stamps
Receiving Food Stamps Comparison
Peruvians
Immigrants from Belize
11.7%
RECEIVING FOOD STAMPS
49.3/ 100
METRIC RATING
176th/ 347
METRIC RANK
15.2%
RECEIVING FOOD STAMPS
0.0/ 100
METRIC RATING
288th/ 347
METRIC RANK
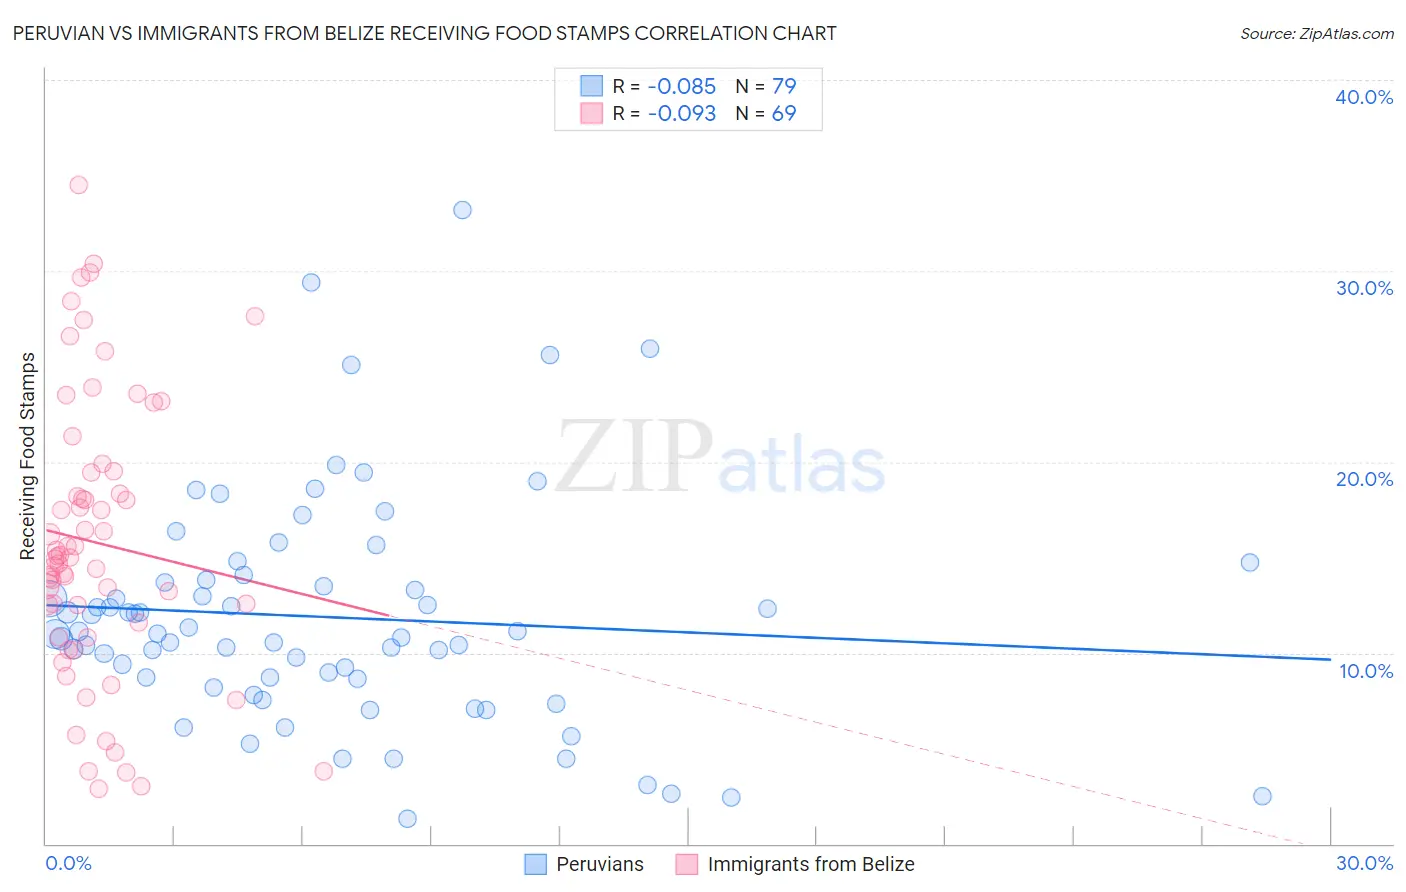
Peruvian vs Immigrants from Belize Receiving Food Stamps Correlation Chart
The statistical analysis conducted on geographies consisting of 362,284,397 people shows a slight negative correlation between the proportion of Peruvians and percentage of population receiving government assistance and/or food stamps in the United States with a correlation coefficient (R) of -0.085 and weighted average of 11.7%. Similarly, the statistical analysis conducted on geographies consisting of 130,248,376 people shows a slight negative correlation between the proportion of Immigrants from Belize and percentage of population receiving government assistance and/or food stamps in the United States with a correlation coefficient (R) of -0.093 and weighted average of 15.2%, a difference of 29.6%.
Receiving Food Stamps Correlation Summary
| Measurement | Peruvian | Immigrants from Belize |
| Minimum | 1.3% | 2.9% |
| Maximum | 33.2% | 34.5% |
| Range | 31.9% | 31.6% |
| Mean | 11.9% | 15.8% |
| Median | 11.0% | 15.0% |
| Interquartile 25% (IQ1) | 8.7% | 11.2% |
| Interquartile 75% (IQ3) | 13.8% | 19.5% |
| Interquartile Range (IQR) | 5.1% | 8.3% |
| Standard Deviation (Sample) | 6.0% | 7.3% |
| Standard Deviation (Population) | 5.9% | 7.2% |
Similar Demographics by Receiving Food Stamps
Demographics Similar to Peruvians by Receiving Food Stamps
In terms of receiving food stamps, the demographic groups most similar to Peruvians are Osage (11.7%, a difference of 0.070%), Immigrants from Eritrea (11.7%, a difference of 0.10%), Immigrants from Ukraine (11.8%, a difference of 0.13%), German Russian (11.8%, a difference of 0.17%), and Immigrants from Kenya (11.8%, a difference of 0.41%).
| Demographics | Rating | Rank | Receiving Food Stamps |
| Immigrants | Eastern Africa | 58.3 /100 | #169 | Average 11.6% |
| Costa Ricans | 57.9 /100 | #170 | Average 11.6% |
| Immigrants | Western Asia | 56.4 /100 | #171 | Average 11.6% |
| Guamanians/Chamorros | 54.2 /100 | #172 | Average 11.7% |
| Immigrants | Syria | 53.4 /100 | #173 | Average 11.7% |
| Immigrants | Eritrea | 50.0 /100 | #174 | Average 11.7% |
| Osage | 49.8 /100 | #175 | Average 11.7% |
| Peruvians | 49.3 /100 | #176 | Average 11.7% |
| Immigrants | Ukraine | 48.4 /100 | #177 | Average 11.8% |
| German Russians | 48.1 /100 | #178 | Average 11.8% |
| Immigrants | Kenya | 46.4 /100 | #179 | Average 11.8% |
| Uruguayans | 44.8 /100 | #180 | Average 11.8% |
| South American Indians | 41.7 /100 | #181 | Average 11.9% |
| Immigrants | Morocco | 40.7 /100 | #182 | Average 11.9% |
| Immigrants | Uganda | 40.3 /100 | #183 | Average 11.9% |
Demographics Similar to Immigrants from Belize by Receiving Food Stamps
In terms of receiving food stamps, the demographic groups most similar to Immigrants from Belize are Immigrants from Mexico (15.2%, a difference of 0.46%), African (15.1%, a difference of 0.69%), Immigrants from Senegal (15.3%, a difference of 0.77%), Immigrants from Liberia (15.1%, a difference of 0.83%), and Senegalese (15.4%, a difference of 1.0%).
| Demographics | Rating | Rank | Receiving Food Stamps |
| Spanish American Indians | 0.0 /100 | #281 | Tragic 14.9% |
| Immigrants | Central America | 0.0 /100 | #282 | Tragic 15.0% |
| Bangladeshis | 0.0 /100 | #283 | Tragic 15.0% |
| Immigrants | Ecuador | 0.0 /100 | #284 | Tragic 15.0% |
| Immigrants | Liberia | 0.0 /100 | #285 | Tragic 15.1% |
| Africans | 0.0 /100 | #286 | Tragic 15.1% |
| Immigrants | Mexico | 0.0 /100 | #287 | Tragic 15.2% |
| Immigrants | Belize | 0.0 /100 | #288 | Tragic 15.2% |
| Immigrants | Senegal | 0.0 /100 | #289 | Tragic 15.3% |
| Senegalese | 0.0 /100 | #290 | Tragic 15.4% |
| Hondurans | 0.0 /100 | #291 | Tragic 15.5% |
| Alaska Natives | 0.0 /100 | #292 | Tragic 15.6% |
| Vietnamese | 0.0 /100 | #293 | Tragic 15.7% |
| Immigrants | Latin America | 0.0 /100 | #294 | Tragic 15.7% |
| Immigrants | Honduras | 0.0 /100 | #295 | Tragic 15.7% |