Chilean vs Immigrants from Oceania Receiving Food Stamps
COMPARE
Chilean
Immigrants from Oceania
Receiving Food Stamps
Receiving Food Stamps Comparison
Chileans
Immigrants from Oceania
11.0%
RECEIVING FOOD STAMPS
86.2/ 100
METRIC RATING
142nd/ 347
METRIC RANK
11.4%
RECEIVING FOOD STAMPS
70.4/ 100
METRIC RATING
159th/ 347
METRIC RANK
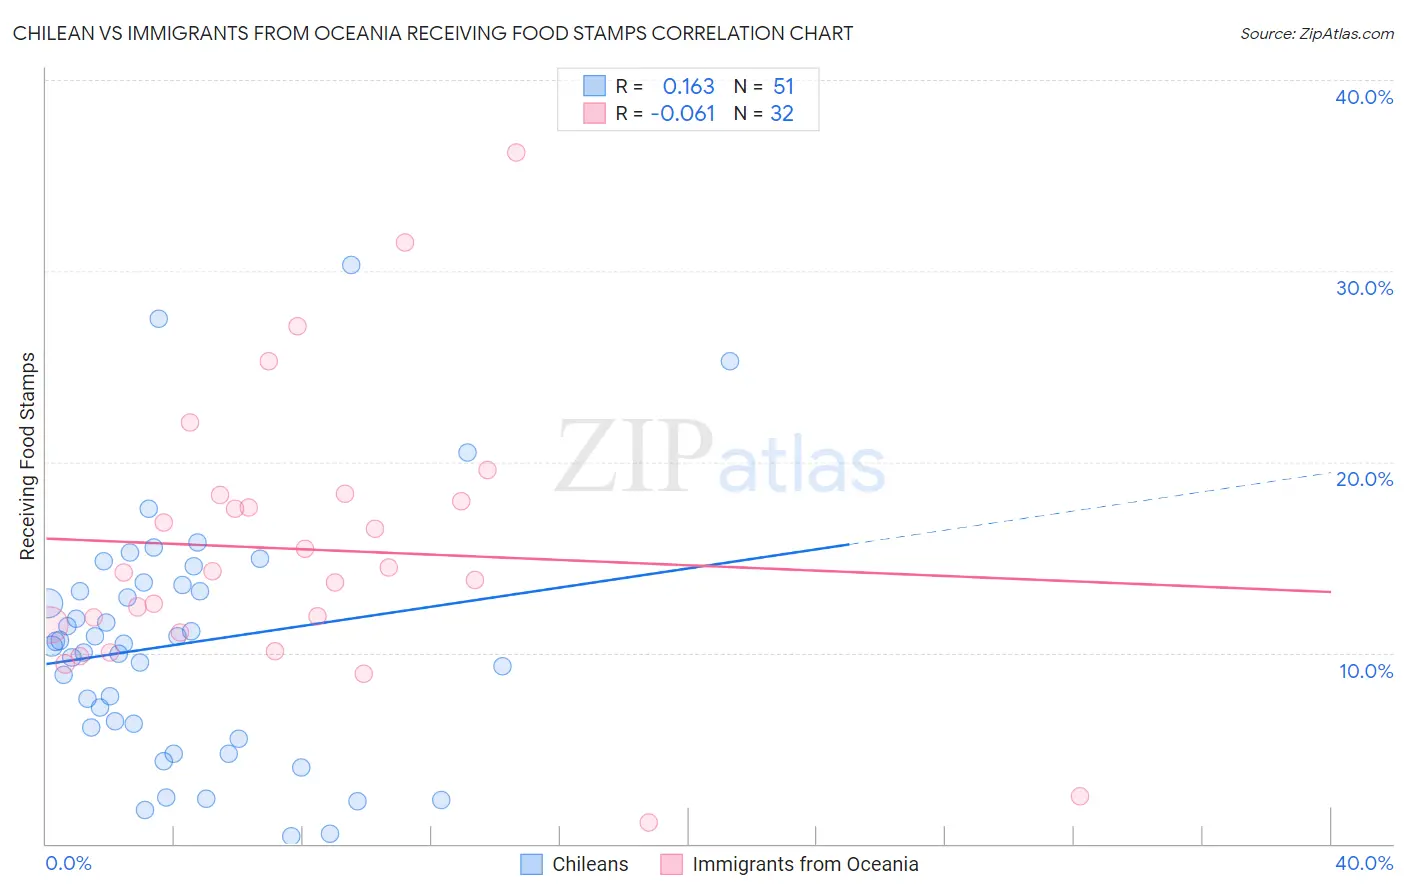
Chilean vs Immigrants from Oceania Receiving Food Stamps Correlation Chart
The statistical analysis conducted on geographies consisting of 256,152,699 people shows a poor positive correlation between the proportion of Chileans and percentage of population receiving government assistance and/or food stamps in the United States with a correlation coefficient (R) of 0.163 and weighted average of 11.0%. Similarly, the statistical analysis conducted on geographies consisting of 304,706,575 people shows a slight negative correlation between the proportion of Immigrants from Oceania and percentage of population receiving government assistance and/or food stamps in the United States with a correlation coefficient (R) of -0.061 and weighted average of 11.4%, a difference of 3.6%.
Receiving Food Stamps Correlation Summary
| Measurement | Chilean | Immigrants from Oceania |
| Minimum | 0.40% | 1.1% |
| Maximum | 30.3% | 36.2% |
| Range | 29.9% | 35.1% |
| Mean | 10.5% | 15.4% |
| Median | 10.5% | 14.2% |
| Interquartile 25% (IQ1) | 6.1% | 11.2% |
| Interquartile 75% (IQ3) | 13.5% | 18.1% |
| Interquartile Range (IQR) | 7.4% | 6.9% |
| Standard Deviation (Sample) | 6.4% | 7.3% |
| Standard Deviation (Population) | 6.3% | 7.2% |
Demographics Similar to Chileans and Immigrants from Oceania by Receiving Food Stamps
In terms of receiving food stamps, the demographic groups most similar to Chileans are Immigrants from Northern Africa (11.0%, a difference of 0.080%), Immigrants from Vietnam (11.0%, a difference of 0.17%), Syrian (11.0%, a difference of 0.23%), Hungarian (11.0%, a difference of 0.35%), and Celtic (10.9%, a difference of 0.53%). Similarly, the demographic groups most similar to Immigrants from Oceania are French Canadian (11.4%, a difference of 0.16%), Immigrants from Bosnia and Herzegovina (11.3%, a difference of 0.39%), Immigrants from Lebanon (11.3%, a difference of 0.87%), Immigrants from Afghanistan (11.3%, a difference of 0.95%), and Immigrants from Argentina (11.2%, a difference of 2.0%).
| Demographics | Rating | Rank | Receiving Food Stamps |
| Celtics | 87.8 /100 | #140 | Excellent 10.9% |
| Immigrants | Vietnam | 86.7 /100 | #141 | Excellent 11.0% |
| Chileans | 86.2 /100 | #142 | Excellent 11.0% |
| Immigrants | Northern Africa | 86.0 /100 | #143 | Excellent 11.0% |
| Syrians | 85.5 /100 | #144 | Excellent 11.0% |
| Hungarians | 85.1 /100 | #145 | Excellent 11.0% |
| Taiwanese | 84.2 /100 | #146 | Excellent 11.0% |
| Whites/Caucasians | 83.9 /100 | #147 | Excellent 11.1% |
| Immigrants | South Eastern Asia | 83.3 /100 | #148 | Excellent 11.1% |
| Brazilians | 83.2 /100 | #149 | Excellent 11.1% |
| Soviet Union | 83.1 /100 | #150 | Excellent 11.1% |
| Immigrants | Spain | 81.7 /100 | #151 | Excellent 11.1% |
| Immigrants | Kazakhstan | 81.7 /100 | #152 | Excellent 11.1% |
| Lebanese | 81.6 /100 | #153 | Excellent 11.1% |
| Armenians | 81.4 /100 | #154 | Excellent 11.1% |
| Immigrants | Argentina | 80.4 /100 | #155 | Excellent 11.2% |
| Immigrants | Afghanistan | 75.6 /100 | #156 | Good 11.3% |
| Immigrants | Lebanon | 75.2 /100 | #157 | Good 11.3% |
| Immigrants | Bosnia and Herzegovina | 72.6 /100 | #158 | Good 11.3% |
| Immigrants | Oceania | 70.4 /100 | #159 | Good 11.4% |
| French Canadians | 69.5 /100 | #160 | Good 11.4% |