Luxembourger vs Immigrants from Oceania Receiving Food Stamps
COMPARE
Luxembourger
Immigrants from Oceania
Receiving Food Stamps
Receiving Food Stamps Comparison
Luxembourgers
Immigrants from Oceania
9.1%
RECEIVING FOOD STAMPS
99.8/ 100
METRIC RATING
21st/ 347
METRIC RANK
11.4%
RECEIVING FOOD STAMPS
70.4/ 100
METRIC RATING
159th/ 347
METRIC RANK
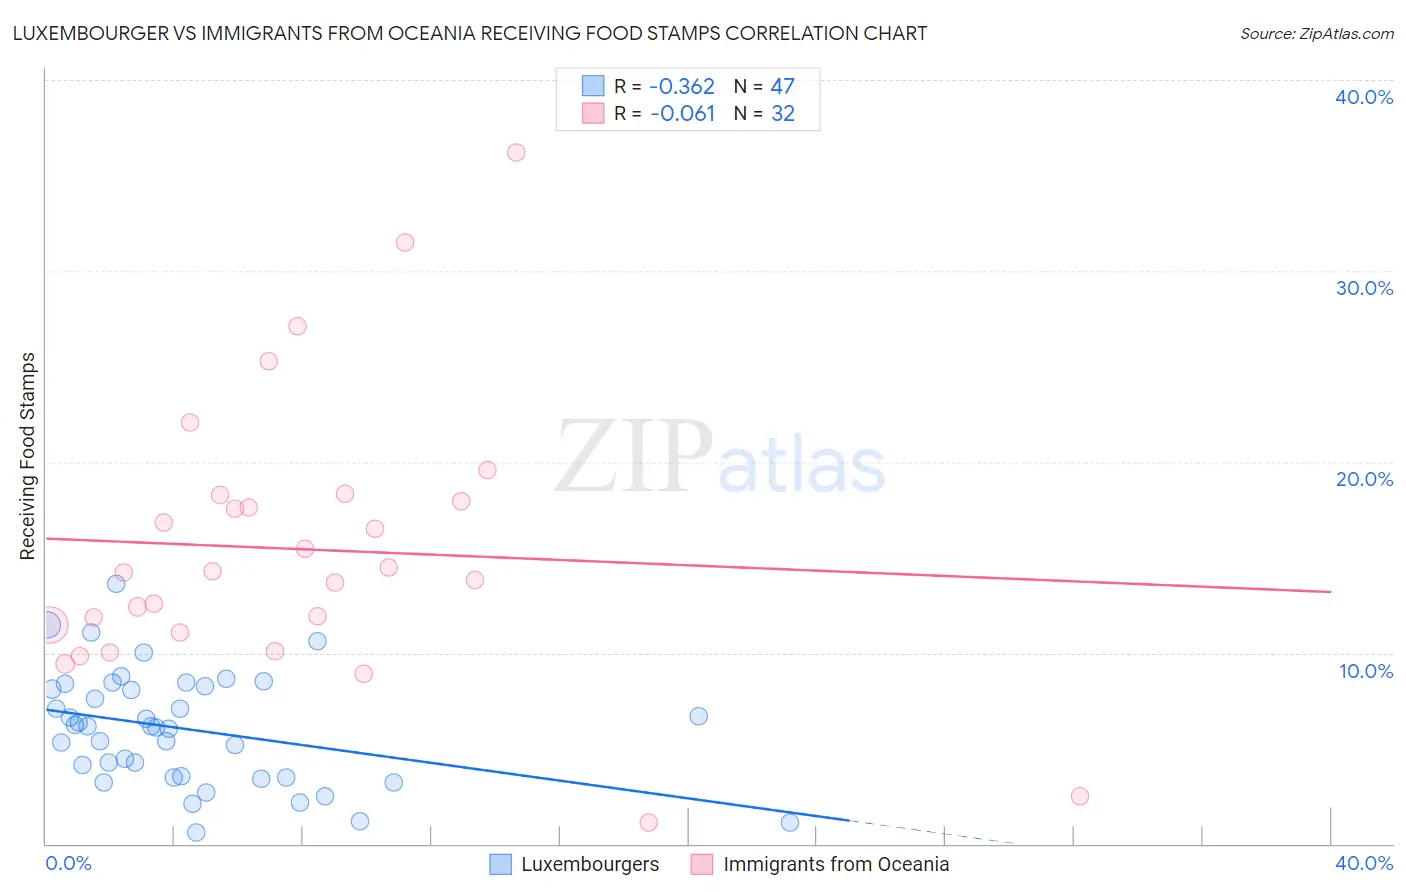
Luxembourger vs Immigrants from Oceania Receiving Food Stamps Correlation Chart
The statistical analysis conducted on geographies consisting of 144,526,649 people shows a mild negative correlation between the proportion of Luxembourgers and percentage of population receiving government assistance and/or food stamps in the United States with a correlation coefficient (R) of -0.362 and weighted average of 9.1%. Similarly, the statistical analysis conducted on geographies consisting of 304,706,575 people shows a slight negative correlation between the proportion of Immigrants from Oceania and percentage of population receiving government assistance and/or food stamps in the United States with a correlation coefficient (R) of -0.061 and weighted average of 11.4%, a difference of 24.6%.
Receiving Food Stamps Correlation Summary
| Measurement | Luxembourger | Immigrants from Oceania |
| Minimum | 0.57% | 1.1% |
| Maximum | 13.6% | 36.2% |
| Range | 13.1% | 35.1% |
| Mean | 6.0% | 15.4% |
| Median | 6.2% | 14.2% |
| Interquartile 25% (IQ1) | 3.5% | 11.2% |
| Interquartile 75% (IQ3) | 8.2% | 18.1% |
| Interquartile Range (IQR) | 4.7% | 6.9% |
| Standard Deviation (Sample) | 2.9% | 7.3% |
| Standard Deviation (Population) | 2.9% | 7.2% |
Similar Demographics by Receiving Food Stamps
Demographics Similar to Luxembourgers by Receiving Food Stamps
In terms of receiving food stamps, the demographic groups most similar to Luxembourgers are Latvian (9.1%, a difference of 0.15%), Immigrants from Australia (9.2%, a difference of 0.25%), Eastern European (9.2%, a difference of 0.36%), Immigrants from Northern Europe (9.2%, a difference of 0.38%), and Immigrants from Hong Kong (9.1%, a difference of 0.48%).
| Demographics | Rating | Rank | Receiving Food Stamps |
| Maltese | 99.9 /100 | #14 | Exceptional 8.9% |
| Norwegians | 99.9 /100 | #15 | Exceptional 9.0% |
| Immigrants | Japan | 99.9 /100 | #16 | Exceptional 9.0% |
| Immigrants | Scotland | 99.9 /100 | #17 | Exceptional 9.0% |
| Danes | 99.9 /100 | #18 | Exceptional 9.0% |
| Immigrants | Hong Kong | 99.8 /100 | #19 | Exceptional 9.1% |
| Latvians | 99.8 /100 | #20 | Exceptional 9.1% |
| Luxembourgers | 99.8 /100 | #21 | Exceptional 9.1% |
| Immigrants | Australia | 99.8 /100 | #22 | Exceptional 9.2% |
| Eastern Europeans | 99.8 /100 | #23 | Exceptional 9.2% |
| Immigrants | Northern Europe | 99.8 /100 | #24 | Exceptional 9.2% |
| Immigrants | Ireland | 99.8 /100 | #25 | Exceptional 9.2% |
| Swedes | 99.8 /100 | #26 | Exceptional 9.2% |
| Bhutanese | 99.8 /100 | #27 | Exceptional 9.2% |
| Czechs | 99.8 /100 | #28 | Exceptional 9.2% |
Demographics Similar to Immigrants from Oceania by Receiving Food Stamps
In terms of receiving food stamps, the demographic groups most similar to Immigrants from Oceania are French Canadian (11.4%, a difference of 0.16%), Pennsylvania German (11.4%, a difference of 0.34%), Immigrants from Bosnia and Herzegovina (11.3%, a difference of 0.39%), Alsatian (11.4%, a difference of 0.41%), and Immigrants from Southern Europe (11.5%, a difference of 0.78%).
| Demographics | Rating | Rank | Receiving Food Stamps |
| Immigrants | Kazakhstan | 81.7 /100 | #152 | Excellent 11.1% |
| Lebanese | 81.6 /100 | #153 | Excellent 11.1% |
| Armenians | 81.4 /100 | #154 | Excellent 11.1% |
| Immigrants | Argentina | 80.4 /100 | #155 | Excellent 11.2% |
| Immigrants | Afghanistan | 75.6 /100 | #156 | Good 11.3% |
| Immigrants | Lebanon | 75.2 /100 | #157 | Good 11.3% |
| Immigrants | Bosnia and Herzegovina | 72.6 /100 | #158 | Good 11.3% |
| Immigrants | Oceania | 70.4 /100 | #159 | Good 11.4% |
| French Canadians | 69.5 /100 | #160 | Good 11.4% |
| Pennsylvania Germans | 68.4 /100 | #161 | Good 11.4% |
| Alsatians | 68.0 /100 | #162 | Good 11.4% |
| Immigrants | Southern Europe | 65.8 /100 | #163 | Good 11.5% |
| Immigrants | Chile | 65.0 /100 | #164 | Good 11.5% |
| Arabs | 64.7 /100 | #165 | Good 11.5% |
| Immigrants | Belarus | 62.8 /100 | #166 | Good 11.5% |