Peruvian vs Immigrants from South Central Asia Receiving Food Stamps
COMPARE
Peruvian
Immigrants from South Central Asia
Receiving Food Stamps
Receiving Food Stamps Comparison
Peruvians
Immigrants from South Central Asia
11.7%
RECEIVING FOOD STAMPS
49.3/ 100
METRIC RATING
176th/ 347
METRIC RANK
8.8%
RECEIVING FOOD STAMPS
99.9/ 100
METRIC RATING
10th/ 347
METRIC RANK
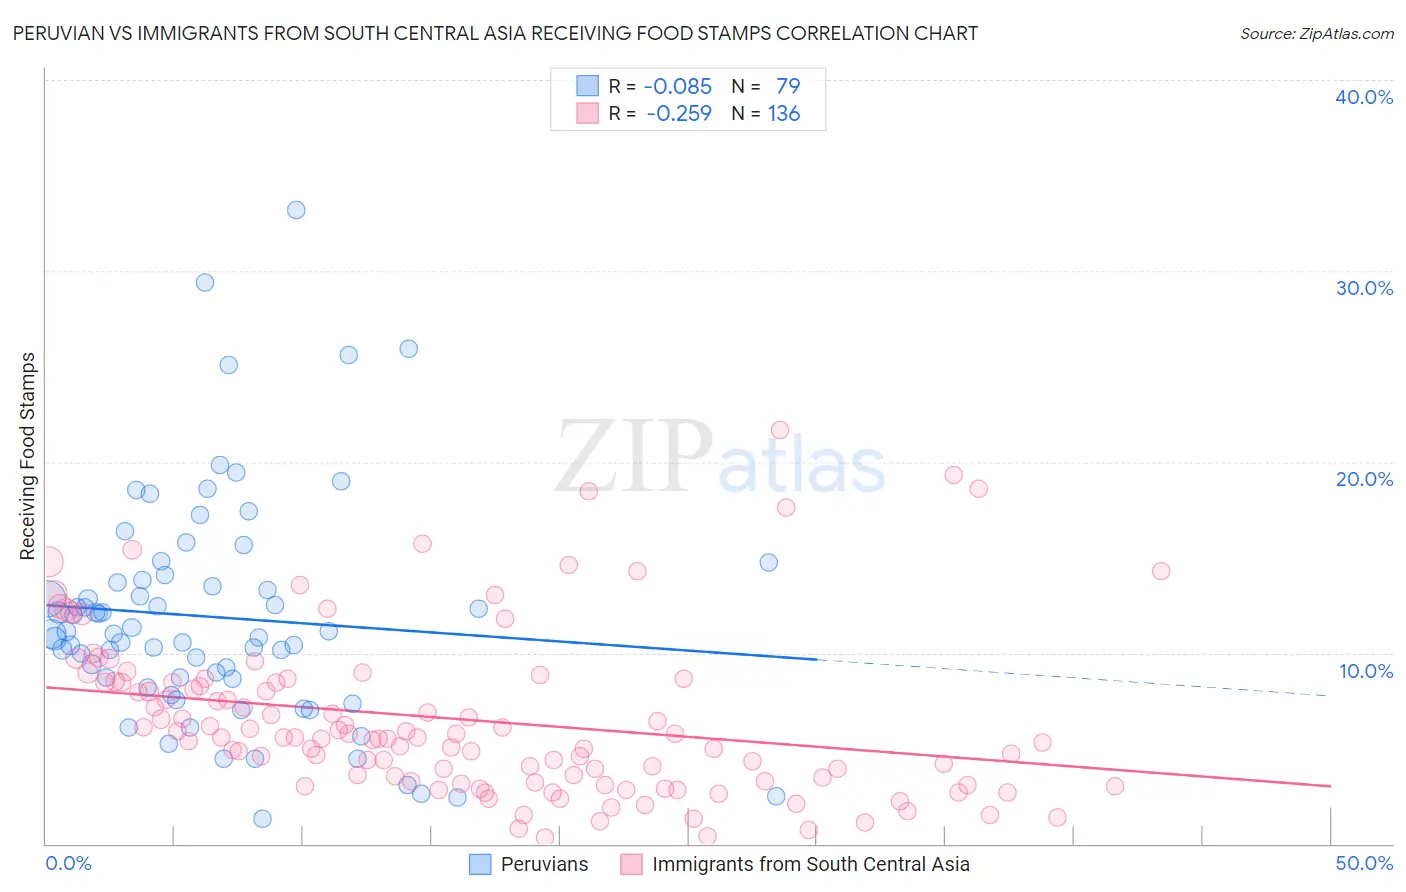
Peruvian vs Immigrants from South Central Asia Receiving Food Stamps Correlation Chart
The statistical analysis conducted on geographies consisting of 362,284,397 people shows a slight negative correlation between the proportion of Peruvians and percentage of population receiving government assistance and/or food stamps in the United States with a correlation coefficient (R) of -0.085 and weighted average of 11.7%. Similarly, the statistical analysis conducted on geographies consisting of 471,034,048 people shows a weak negative correlation between the proportion of Immigrants from South Central Asia and percentage of population receiving government assistance and/or food stamps in the United States with a correlation coefficient (R) of -0.259 and weighted average of 8.8%, a difference of 33.0%.
Receiving Food Stamps Correlation Summary
| Measurement | Peruvian | Immigrants from South Central Asia |
| Minimum | 1.3% | 0.30% |
| Maximum | 33.2% | 21.7% |
| Range | 31.9% | 21.4% |
| Mean | 11.9% | 6.5% |
| Median | 11.0% | 5.6% |
| Interquartile 25% (IQ1) | 8.7% | 3.3% |
| Interquartile 75% (IQ3) | 13.8% | 8.5% |
| Interquartile Range (IQR) | 5.1% | 5.2% |
| Standard Deviation (Sample) | 6.0% | 4.3% |
| Standard Deviation (Population) | 5.9% | 4.3% |
Similar Demographics by Receiving Food Stamps
Demographics Similar to Peruvians by Receiving Food Stamps
In terms of receiving food stamps, the demographic groups most similar to Peruvians are Osage (11.7%, a difference of 0.070%), Immigrants from Eritrea (11.7%, a difference of 0.10%), Immigrants from Ukraine (11.8%, a difference of 0.13%), German Russian (11.8%, a difference of 0.17%), and Immigrants from Kenya (11.8%, a difference of 0.41%).
| Demographics | Rating | Rank | Receiving Food Stamps |
| Immigrants | Eastern Africa | 58.3 /100 | #169 | Average 11.6% |
| Costa Ricans | 57.9 /100 | #170 | Average 11.6% |
| Immigrants | Western Asia | 56.4 /100 | #171 | Average 11.6% |
| Guamanians/Chamorros | 54.2 /100 | #172 | Average 11.7% |
| Immigrants | Syria | 53.4 /100 | #173 | Average 11.7% |
| Immigrants | Eritrea | 50.0 /100 | #174 | Average 11.7% |
| Osage | 49.8 /100 | #175 | Average 11.7% |
| Peruvians | 49.3 /100 | #176 | Average 11.7% |
| Immigrants | Ukraine | 48.4 /100 | #177 | Average 11.8% |
| German Russians | 48.1 /100 | #178 | Average 11.8% |
| Immigrants | Kenya | 46.4 /100 | #179 | Average 11.8% |
| Uruguayans | 44.8 /100 | #180 | Average 11.8% |
| South American Indians | 41.7 /100 | #181 | Average 11.9% |
| Immigrants | Morocco | 40.7 /100 | #182 | Average 11.9% |
| Immigrants | Uganda | 40.3 /100 | #183 | Average 11.9% |
Demographics Similar to Immigrants from South Central Asia by Receiving Food Stamps
In terms of receiving food stamps, the demographic groups most similar to Immigrants from South Central Asia are Okinawan (8.9%, a difference of 0.43%), Cypriot (8.9%, a difference of 0.44%), Bulgarian (8.9%, a difference of 0.63%), Maltese (8.9%, a difference of 0.77%), and Norwegian (9.0%, a difference of 1.4%).
| Demographics | Rating | Rank | Receiving Food Stamps |
| Filipinos | 100.0 /100 | #3 | Exceptional 7.4% |
| Iranians | 100.0 /100 | #4 | Exceptional 7.9% |
| Thais | 100.0 /100 | #5 | Exceptional 8.1% |
| Immigrants | Singapore | 100.0 /100 | #6 | Exceptional 8.3% |
| Immigrants | Iran | 100.0 /100 | #7 | Exceptional 8.3% |
| Burmese | 99.9 /100 | #8 | Exceptional 8.6% |
| Immigrants | Korea | 99.9 /100 | #9 | Exceptional 8.7% |
| Immigrants | South Central Asia | 99.9 /100 | #10 | Exceptional 8.8% |
| Okinawans | 99.9 /100 | #11 | Exceptional 8.9% |
| Cypriots | 99.9 /100 | #12 | Exceptional 8.9% |
| Bulgarians | 99.9 /100 | #13 | Exceptional 8.9% |
| Maltese | 99.9 /100 | #14 | Exceptional 8.9% |
| Norwegians | 99.9 /100 | #15 | Exceptional 9.0% |
| Immigrants | Japan | 99.9 /100 | #16 | Exceptional 9.0% |
| Immigrants | Scotland | 99.9 /100 | #17 | Exceptional 9.0% |