Peruvian vs Immigrants from Venezuela Receiving Food Stamps
COMPARE
Peruvian
Immigrants from Venezuela
Receiving Food Stamps
Receiving Food Stamps Comparison
Peruvians
Immigrants from Venezuela
11.7%
RECEIVING FOOD STAMPS
49.3/ 100
METRIC RATING
176th/ 347
METRIC RANK
12.3%
RECEIVING FOOD STAMPS
20.1/ 100
METRIC RATING
202nd/ 347
METRIC RANK
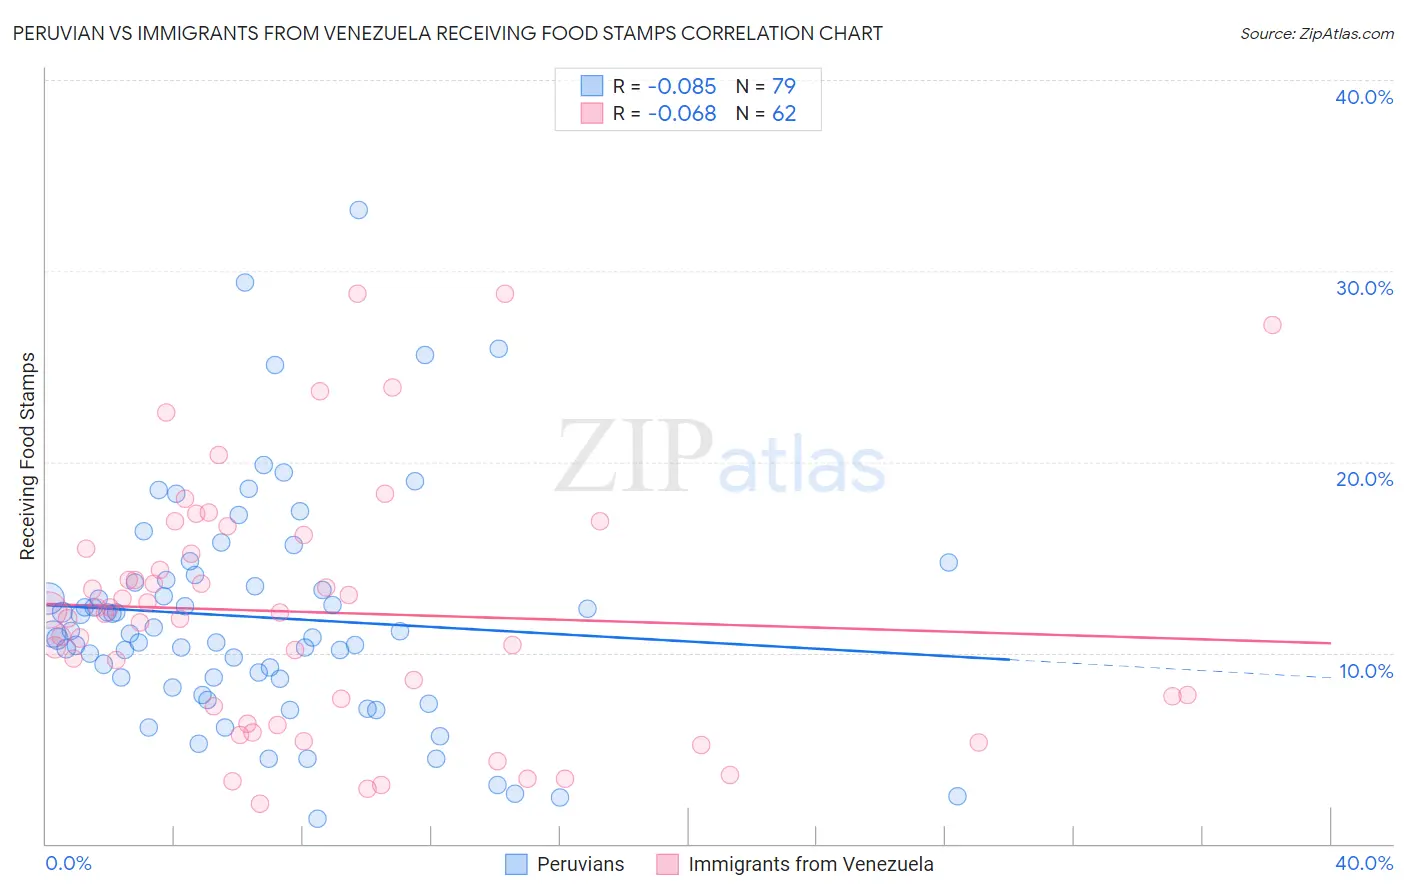
Peruvian vs Immigrants from Venezuela Receiving Food Stamps Correlation Chart
The statistical analysis conducted on geographies consisting of 362,284,397 people shows a slight negative correlation between the proportion of Peruvians and percentage of population receiving government assistance and/or food stamps in the United States with a correlation coefficient (R) of -0.085 and weighted average of 11.7%. Similarly, the statistical analysis conducted on geographies consisting of 287,368,478 people shows a slight negative correlation between the proportion of Immigrants from Venezuela and percentage of population receiving government assistance and/or food stamps in the United States with a correlation coefficient (R) of -0.068 and weighted average of 12.3%, a difference of 4.7%.
Receiving Food Stamps Correlation Summary
| Measurement | Peruvian | Immigrants from Venezuela |
| Minimum | 1.3% | 2.1% |
| Maximum | 33.2% | 28.8% |
| Range | 31.9% | 26.7% |
| Mean | 11.9% | 12.1% |
| Median | 11.0% | 12.1% |
| Interquartile 25% (IQ1) | 8.7% | 7.2% |
| Interquartile 75% (IQ3) | 13.8% | 15.5% |
| Interquartile Range (IQR) | 5.1% | 8.3% |
| Standard Deviation (Sample) | 6.0% | 6.4% |
| Standard Deviation (Population) | 5.9% | 6.4% |
Similar Demographics by Receiving Food Stamps
Demographics Similar to Peruvians by Receiving Food Stamps
In terms of receiving food stamps, the demographic groups most similar to Peruvians are Osage (11.7%, a difference of 0.070%), Immigrants from Eritrea (11.7%, a difference of 0.10%), Immigrants from Ukraine (11.8%, a difference of 0.13%), German Russian (11.8%, a difference of 0.17%), and Immigrants from Kenya (11.8%, a difference of 0.41%).
| Demographics | Rating | Rank | Receiving Food Stamps |
| Immigrants | Eastern Africa | 58.3 /100 | #169 | Average 11.6% |
| Costa Ricans | 57.9 /100 | #170 | Average 11.6% |
| Immigrants | Western Asia | 56.4 /100 | #171 | Average 11.6% |
| Guamanians/Chamorros | 54.2 /100 | #172 | Average 11.7% |
| Immigrants | Syria | 53.4 /100 | #173 | Average 11.7% |
| Immigrants | Eritrea | 50.0 /100 | #174 | Average 11.7% |
| Osage | 49.8 /100 | #175 | Average 11.7% |
| Peruvians | 49.3 /100 | #176 | Average 11.7% |
| Immigrants | Ukraine | 48.4 /100 | #177 | Average 11.8% |
| German Russians | 48.1 /100 | #178 | Average 11.8% |
| Immigrants | Kenya | 46.4 /100 | #179 | Average 11.8% |
| Uruguayans | 44.8 /100 | #180 | Average 11.8% |
| South American Indians | 41.7 /100 | #181 | Average 11.9% |
| Immigrants | Morocco | 40.7 /100 | #182 | Average 11.9% |
| Immigrants | Uganda | 40.3 /100 | #183 | Average 11.9% |
Demographics Similar to Immigrants from Venezuela by Receiving Food Stamps
In terms of receiving food stamps, the demographic groups most similar to Immigrants from Venezuela are Ugandan (12.2%, a difference of 0.48%), Shoshone (12.4%, a difference of 0.53%), Nonimmigrants (12.4%, a difference of 0.56%), Aleut (12.4%, a difference of 0.62%), and Sierra Leonean (12.2%, a difference of 0.68%).
| Demographics | Rating | Rank | Receiving Food Stamps |
| Americans | 26.7 /100 | #195 | Fair 12.2% |
| Iraqis | 26.6 /100 | #196 | Fair 12.2% |
| Delaware | 26.1 /100 | #197 | Fair 12.2% |
| Immigrants | Costa Rica | 25.4 /100 | #198 | Fair 12.2% |
| Portuguese | 25.1 /100 | #199 | Fair 12.2% |
| Sierra Leoneans | 23.6 /100 | #200 | Fair 12.2% |
| Ugandans | 22.5 /100 | #201 | Fair 12.2% |
| Immigrants | Venezuela | 20.1 /100 | #202 | Fair 12.3% |
| Shoshone | 17.7 /100 | #203 | Poor 12.4% |
| Immigrants | Nonimmigrants | 17.6 /100 | #204 | Poor 12.4% |
| Aleuts | 17.3 /100 | #205 | Poor 12.4% |
| Immigrants | Thailand | 17.0 /100 | #206 | Poor 12.4% |
| South Americans | 16.0 /100 | #207 | Poor 12.4% |
| Potawatomi | 14.6 /100 | #208 | Poor 12.5% |
| Immigrants | Sierra Leone | 12.9 /100 | #209 | Poor 12.5% |