Peruvian vs Immigrants from Oceania Self-Care Disability
COMPARE
Peruvian
Immigrants from Oceania
Self-Care Disability
Self-Care Disability Comparison
Peruvians
Immigrants from Oceania
2.4%
SELF-CARE DISABILITY
91.3/ 100
METRIC RATING
121st/ 347
METRIC RANK
2.5%
SELF-CARE DISABILITY
28.3/ 100
METRIC RATING
188th/ 347
METRIC RANK
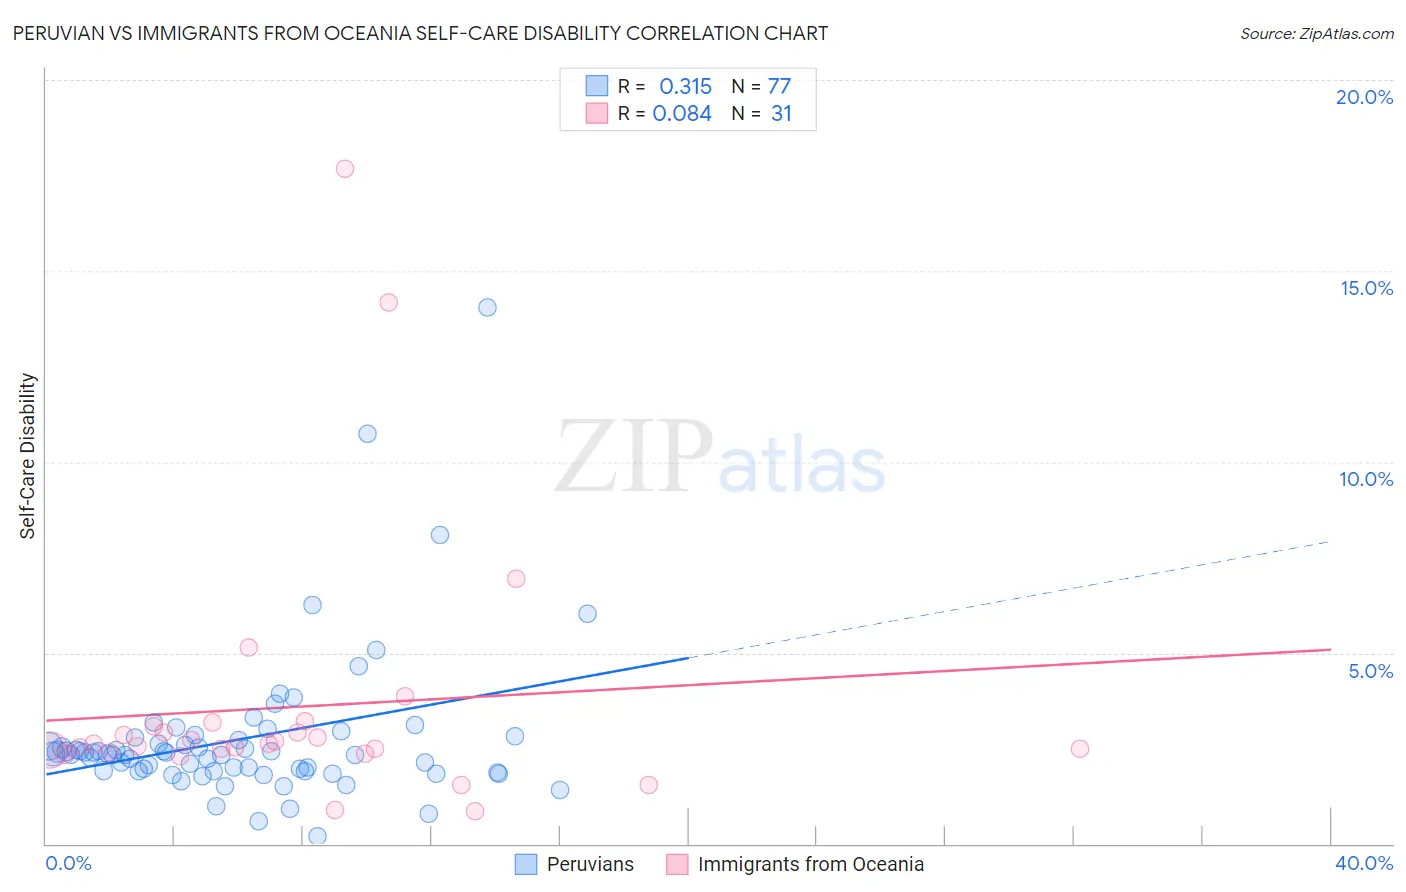
Peruvian vs Immigrants from Oceania Self-Care Disability Correlation Chart
The statistical analysis conducted on geographies consisting of 362,873,301 people shows a mild positive correlation between the proportion of Peruvians and percentage of population with self-care disability in the United States with a correlation coefficient (R) of 0.315 and weighted average of 2.4%. Similarly, the statistical analysis conducted on geographies consisting of 305,144,146 people shows a slight positive correlation between the proportion of Immigrants from Oceania and percentage of population with self-care disability in the United States with a correlation coefficient (R) of 0.084 and weighted average of 2.5%, a difference of 4.0%.
Self-Care Disability Correlation Summary
| Measurement | Peruvian | Immigrants from Oceania |
| Minimum | 0.20% | 0.86% |
| Maximum | 14.1% | 17.7% |
| Range | 13.9% | 16.8% |
| Mean | 2.7% | 3.6% |
| Median | 2.3% | 2.6% |
| Interquartile 25% (IQ1) | 1.9% | 2.4% |
| Interquartile 75% (IQ3) | 2.8% | 3.1% |
| Interquartile Range (IQR) | 0.86% | 0.68% |
| Standard Deviation (Sample) | 2.0% | 3.5% |
| Standard Deviation (Population) | 2.0% | 3.4% |
Similar Demographics by Self-Care Disability
Demographics Similar to Peruvians by Self-Care Disability
In terms of self-care disability, the demographic groups most similar to Peruvians are Uruguayan (2.4%, a difference of 0.030%), Immigrants from Sierra Leone (2.4%, a difference of 0.070%), Belgian (2.4%, a difference of 0.070%), Immigrants from Canada (2.4%, a difference of 0.11%), and Immigrants from Nigeria (2.4%, a difference of 0.15%).
| Demographics | Rating | Rank | Self-Care Disability |
| Immigrants | North Macedonia | 93.1 /100 | #114 | Exceptional 2.4% |
| Immigrants | Hong Kong | 93.1 /100 | #115 | Exceptional 2.4% |
| Northern Europeans | 92.9 /100 | #116 | Exceptional 2.4% |
| Taiwanese | 92.5 /100 | #117 | Exceptional 2.4% |
| Immigrants | Canada | 92.0 /100 | #118 | Exceptional 2.4% |
| Immigrants | Sierra Leone | 91.8 /100 | #119 | Exceptional 2.4% |
| Uruguayans | 91.5 /100 | #120 | Exceptional 2.4% |
| Peruvians | 91.3 /100 | #121 | Exceptional 2.4% |
| Belgians | 90.9 /100 | #122 | Exceptional 2.4% |
| Immigrants | Nigeria | 90.3 /100 | #123 | Exceptional 2.4% |
| Immigrants | North America | 90.2 /100 | #124 | Exceptional 2.4% |
| Immigrants | Morocco | 90.2 /100 | #124 | Exceptional 2.4% |
| Hmong | 89.9 /100 | #126 | Excellent 2.4% |
| Colombians | 89.7 /100 | #127 | Excellent 2.4% |
| Immigrants | Hungary | 89.6 /100 | #128 | Excellent 2.4% |
Demographics Similar to Immigrants from Oceania by Self-Care Disability
In terms of self-care disability, the demographic groups most similar to Immigrants from Oceania are Immigrants from Eastern Europe (2.5%, a difference of 0.010%), Irish (2.5%, a difference of 0.030%), Sioux (2.5%, a difference of 0.22%), Immigrants from El Salvador (2.5%, a difference of 0.26%), and Slavic (2.5%, a difference of 0.33%).
| Demographics | Rating | Rank | Self-Care Disability |
| Ghanaians | 40.4 /100 | #181 | Average 2.5% |
| Maltese | 37.5 /100 | #182 | Fair 2.5% |
| Salvadorans | 36.4 /100 | #183 | Fair 2.5% |
| Yugoslavians | 36.1 /100 | #184 | Fair 2.5% |
| Slavs | 34.3 /100 | #185 | Fair 2.5% |
| Immigrants | El Salvador | 33.0 /100 | #186 | Fair 2.5% |
| Irish | 28.7 /100 | #187 | Fair 2.5% |
| Immigrants | Oceania | 28.3 /100 | #188 | Fair 2.5% |
| Immigrants | Eastern Europe | 28.0 /100 | #189 | Fair 2.5% |
| Sioux | 24.6 /100 | #190 | Fair 2.5% |
| Moroccans | 22.9 /100 | #191 | Fair 2.5% |
| Soviet Union | 22.2 /100 | #192 | Fair 2.5% |
| Ukrainians | 21.4 /100 | #193 | Fair 2.5% |
| Immigrants | Germany | 17.9 /100 | #194 | Poor 2.5% |
| Immigrants | Southern Europe | 15.6 /100 | #195 | Poor 2.5% |