Peruvian vs Immigrants from Poland Receiving Food Stamps
COMPARE
Peruvian
Immigrants from Poland
Receiving Food Stamps
Receiving Food Stamps Comparison
Peruvians
Immigrants from Poland
11.7%
RECEIVING FOOD STAMPS
49.3/ 100
METRIC RATING
176th/ 347
METRIC RANK
10.6%
RECEIVING FOOD STAMPS
93.9/ 100
METRIC RATING
119th/ 347
METRIC RANK
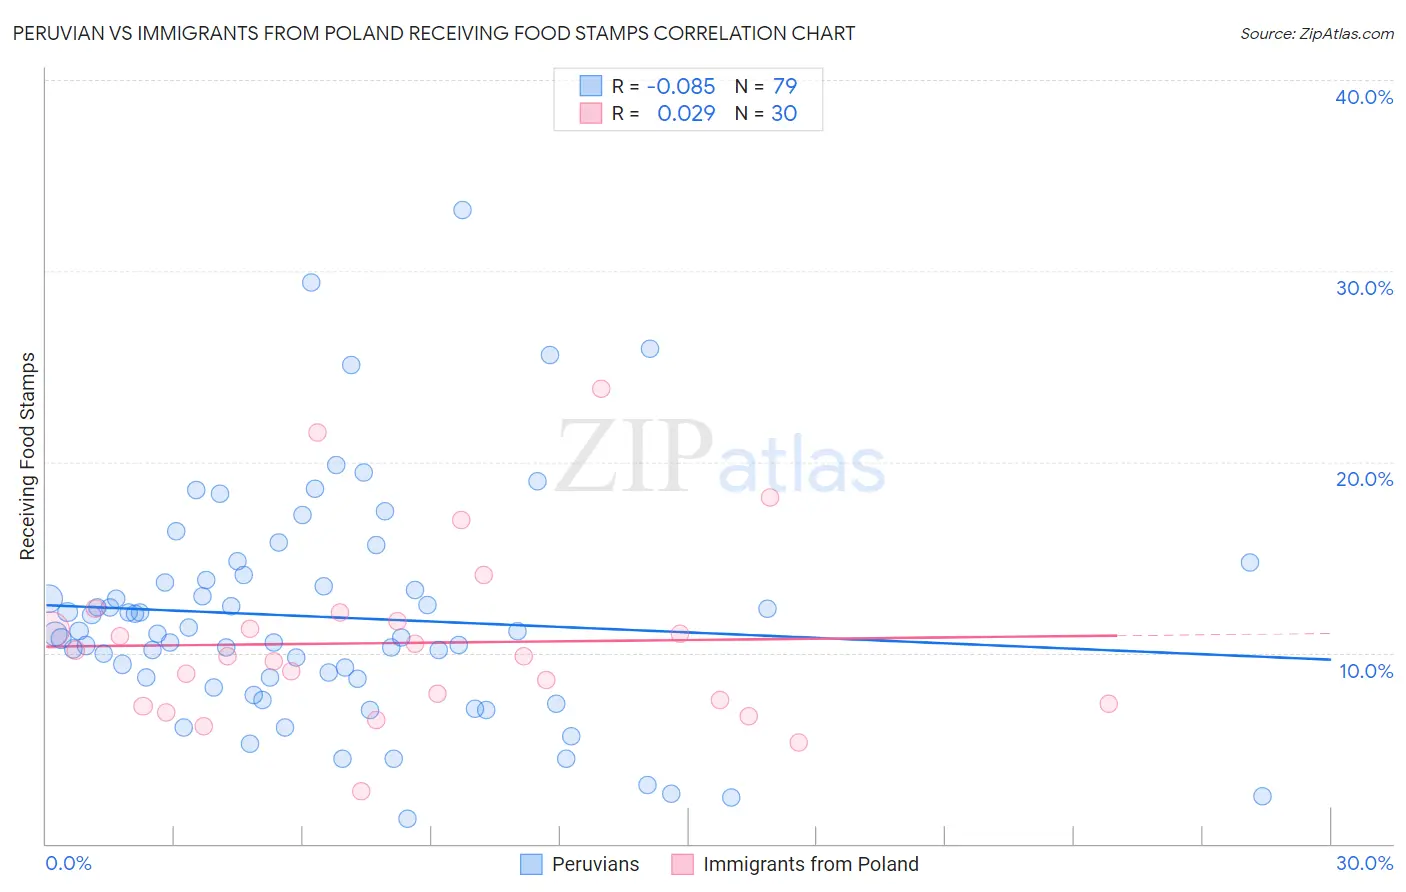
Peruvian vs Immigrants from Poland Receiving Food Stamps Correlation Chart
The statistical analysis conducted on geographies consisting of 362,284,397 people shows a slight negative correlation between the proportion of Peruvians and percentage of population receiving government assistance and/or food stamps in the United States with a correlation coefficient (R) of -0.085 and weighted average of 11.7%. Similarly, the statistical analysis conducted on geographies consisting of 304,061,523 people shows no correlation between the proportion of Immigrants from Poland and percentage of population receiving government assistance and/or food stamps in the United States with a correlation coefficient (R) of 0.029 and weighted average of 10.6%, a difference of 10.7%.
Receiving Food Stamps Correlation Summary
| Measurement | Peruvian | Immigrants from Poland |
| Minimum | 1.3% | 2.8% |
| Maximum | 33.2% | 23.8% |
| Range | 31.9% | 21.0% |
| Mean | 11.9% | 10.5% |
| Median | 11.0% | 9.8% |
| Interquartile 25% (IQ1) | 8.7% | 7.3% |
| Interquartile 75% (IQ3) | 13.8% | 11.6% |
| Interquartile Range (IQR) | 5.1% | 4.3% |
| Standard Deviation (Sample) | 6.0% | 4.6% |
| Standard Deviation (Population) | 5.9% | 4.5% |
Similar Demographics by Receiving Food Stamps
Demographics Similar to Peruvians by Receiving Food Stamps
In terms of receiving food stamps, the demographic groups most similar to Peruvians are Osage (11.7%, a difference of 0.070%), Immigrants from Eritrea (11.7%, a difference of 0.10%), Immigrants from Ukraine (11.8%, a difference of 0.13%), German Russian (11.8%, a difference of 0.17%), and Immigrants from Kenya (11.8%, a difference of 0.41%).
| Demographics | Rating | Rank | Receiving Food Stamps |
| Immigrants | Eastern Africa | 58.3 /100 | #169 | Average 11.6% |
| Costa Ricans | 57.9 /100 | #170 | Average 11.6% |
| Immigrants | Western Asia | 56.4 /100 | #171 | Average 11.6% |
| Guamanians/Chamorros | 54.2 /100 | #172 | Average 11.7% |
| Immigrants | Syria | 53.4 /100 | #173 | Average 11.7% |
| Immigrants | Eritrea | 50.0 /100 | #174 | Average 11.7% |
| Osage | 49.8 /100 | #175 | Average 11.7% |
| Peruvians | 49.3 /100 | #176 | Average 11.7% |
| Immigrants | Ukraine | 48.4 /100 | #177 | Average 11.8% |
| German Russians | 48.1 /100 | #178 | Average 11.8% |
| Immigrants | Kenya | 46.4 /100 | #179 | Average 11.8% |
| Uruguayans | 44.8 /100 | #180 | Average 11.8% |
| South American Indians | 41.7 /100 | #181 | Average 11.9% |
| Immigrants | Morocco | 40.7 /100 | #182 | Average 11.9% |
| Immigrants | Uganda | 40.3 /100 | #183 | Average 11.9% |
Demographics Similar to Immigrants from Poland by Receiving Food Stamps
In terms of receiving food stamps, the demographic groups most similar to Immigrants from Poland are Ethiopian (10.6%, a difference of 0.0%), Slavic (10.6%, a difference of 0.030%), Sri Lankan (10.6%, a difference of 0.11%), Assyrian/Chaldean/Syriac (10.6%, a difference of 0.16%), and Immigrants from Philippines (10.7%, a difference of 0.36%).
| Demographics | Rating | Rank | Receiving Food Stamps |
| Mongolians | 95.8 /100 | #112 | Exceptional 10.5% |
| Icelanders | 95.4 /100 | #113 | Exceptional 10.5% |
| Scotch-Irish | 95.1 /100 | #114 | Exceptional 10.5% |
| Immigrants | Saudi Arabia | 94.9 /100 | #115 | Exceptional 10.5% |
| Canadians | 94.8 /100 | #116 | Exceptional 10.5% |
| Immigrants | Nepal | 94.6 /100 | #117 | Exceptional 10.6% |
| Assyrians/Chaldeans/Syriacs | 94.1 /100 | #118 | Exceptional 10.6% |
| Immigrants | Poland | 93.9 /100 | #119 | Exceptional 10.6% |
| Ethiopians | 93.9 /100 | #120 | Exceptional 10.6% |
| Slavs | 93.8 /100 | #121 | Exceptional 10.6% |
| Sri Lankans | 93.7 /100 | #122 | Exceptional 10.6% |
| Immigrants | Philippines | 93.3 /100 | #123 | Exceptional 10.7% |
| Paraguayans | 93.0 /100 | #124 | Exceptional 10.7% |
| Ukrainians | 92.8 /100 | #125 | Exceptional 10.7% |
| Afghans | 92.6 /100 | #126 | Exceptional 10.7% |