Peruvian vs Immigrants from Grenada Receiving Food Stamps
COMPARE
Peruvian
Immigrants from Grenada
Receiving Food Stamps
Receiving Food Stamps Comparison
Peruvians
Immigrants from Grenada
11.7%
RECEIVING FOOD STAMPS
49.3/ 100
METRIC RATING
176th/ 347
METRIC RANK
17.8%
RECEIVING FOOD STAMPS
0.0/ 100
METRIC RATING
322nd/ 347
METRIC RANK
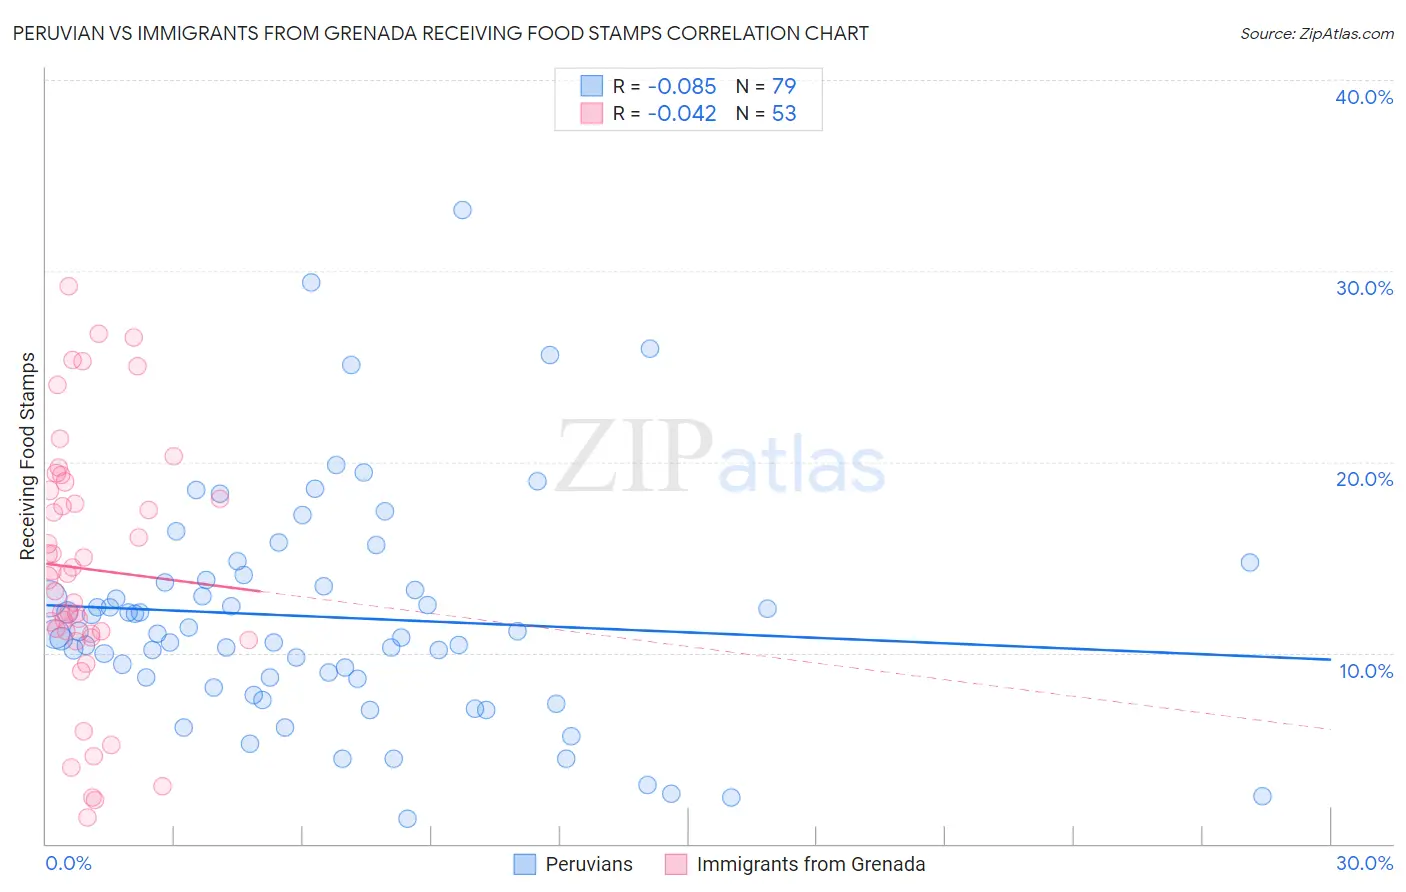
Peruvian vs Immigrants from Grenada Receiving Food Stamps Correlation Chart
The statistical analysis conducted on geographies consisting of 362,284,397 people shows a slight negative correlation between the proportion of Peruvians and percentage of population receiving government assistance and/or food stamps in the United States with a correlation coefficient (R) of -0.085 and weighted average of 11.7%. Similarly, the statistical analysis conducted on geographies consisting of 67,031,750 people shows no correlation between the proportion of Immigrants from Grenada and percentage of population receiving government assistance and/or food stamps in the United States with a correlation coefficient (R) of -0.042 and weighted average of 17.8%, a difference of 51.3%.
Receiving Food Stamps Correlation Summary
| Measurement | Peruvian | Immigrants from Grenada |
| Minimum | 1.3% | 1.4% |
| Maximum | 33.2% | 29.2% |
| Range | 31.9% | 27.8% |
| Mean | 11.9% | 14.4% |
| Median | 11.0% | 14.2% |
| Interquartile 25% (IQ1) | 8.7% | 10.9% |
| Interquartile 75% (IQ3) | 13.8% | 18.7% |
| Interquartile Range (IQR) | 5.1% | 7.8% |
| Standard Deviation (Sample) | 6.0% | 6.7% |
| Standard Deviation (Population) | 5.9% | 6.7% |
Similar Demographics by Receiving Food Stamps
Demographics Similar to Peruvians by Receiving Food Stamps
In terms of receiving food stamps, the demographic groups most similar to Peruvians are Osage (11.7%, a difference of 0.070%), Immigrants from Eritrea (11.7%, a difference of 0.10%), Immigrants from Ukraine (11.8%, a difference of 0.13%), German Russian (11.8%, a difference of 0.17%), and Immigrants from Kenya (11.8%, a difference of 0.41%).
| Demographics | Rating | Rank | Receiving Food Stamps |
| Immigrants | Eastern Africa | 58.3 /100 | #169 | Average 11.6% |
| Costa Ricans | 57.9 /100 | #170 | Average 11.6% |
| Immigrants | Western Asia | 56.4 /100 | #171 | Average 11.6% |
| Guamanians/Chamorros | 54.2 /100 | #172 | Average 11.7% |
| Immigrants | Syria | 53.4 /100 | #173 | Average 11.7% |
| Immigrants | Eritrea | 50.0 /100 | #174 | Average 11.7% |
| Osage | 49.8 /100 | #175 | Average 11.7% |
| Peruvians | 49.3 /100 | #176 | Average 11.7% |
| Immigrants | Ukraine | 48.4 /100 | #177 | Average 11.8% |
| German Russians | 48.1 /100 | #178 | Average 11.8% |
| Immigrants | Kenya | 46.4 /100 | #179 | Average 11.8% |
| Uruguayans | 44.8 /100 | #180 | Average 11.8% |
| South American Indians | 41.7 /100 | #181 | Average 11.9% |
| Immigrants | Morocco | 40.7 /100 | #182 | Average 11.9% |
| Immigrants | Uganda | 40.3 /100 | #183 | Average 11.9% |
Demographics Similar to Immigrants from Grenada by Receiving Food Stamps
In terms of receiving food stamps, the demographic groups most similar to Immigrants from Grenada are Haitian (17.8%, a difference of 0.010%), British West Indian (17.9%, a difference of 0.59%), Immigrants from Haiti (18.2%, a difference of 2.4%), Cuban (18.2%, a difference of 2.5%), and Apache (18.3%, a difference of 2.8%).
| Demographics | Rating | Rank | Receiving Food Stamps |
| Bahamians | 0.0 /100 | #315 | Tragic 17.0% |
| Central American Indians | 0.0 /100 | #316 | Tragic 17.1% |
| Blacks/African Americans | 0.0 /100 | #317 | Tragic 17.2% |
| Menominee | 0.0 /100 | #318 | Tragic 17.2% |
| Immigrants | St. Vincent and the Grenadines | 0.0 /100 | #319 | Tragic 17.2% |
| Immigrants | Nicaragua | 0.0 /100 | #320 | Tragic 17.2% |
| Natives/Alaskans | 0.0 /100 | #321 | Tragic 17.3% |
| Immigrants | Grenada | 0.0 /100 | #322 | Tragic 17.8% |
| Haitians | 0.0 /100 | #323 | Tragic 17.8% |
| British West Indians | 0.0 /100 | #324 | Tragic 17.9% |
| Immigrants | Haiti | 0.0 /100 | #325 | Tragic 18.2% |
| Cubans | 0.0 /100 | #326 | Tragic 18.2% |
| Apache | 0.0 /100 | #327 | Tragic 18.3% |
| Colville | 0.0 /100 | #328 | Tragic 18.3% |
| Immigrants | Dominica | 0.0 /100 | #329 | Tragic 18.4% |