Peruvian vs Chickasaw Poverty
COMPARE
Peruvian
Chickasaw
Poverty
Poverty Comparison
Peruvians
Chickasaw
11.8%
POVERTY
85.6/ 100
METRIC RATING
132nd/ 347
METRIC RANK
14.7%
POVERTY
0.0/ 100
METRIC RATING
272nd/ 347
METRIC RANK
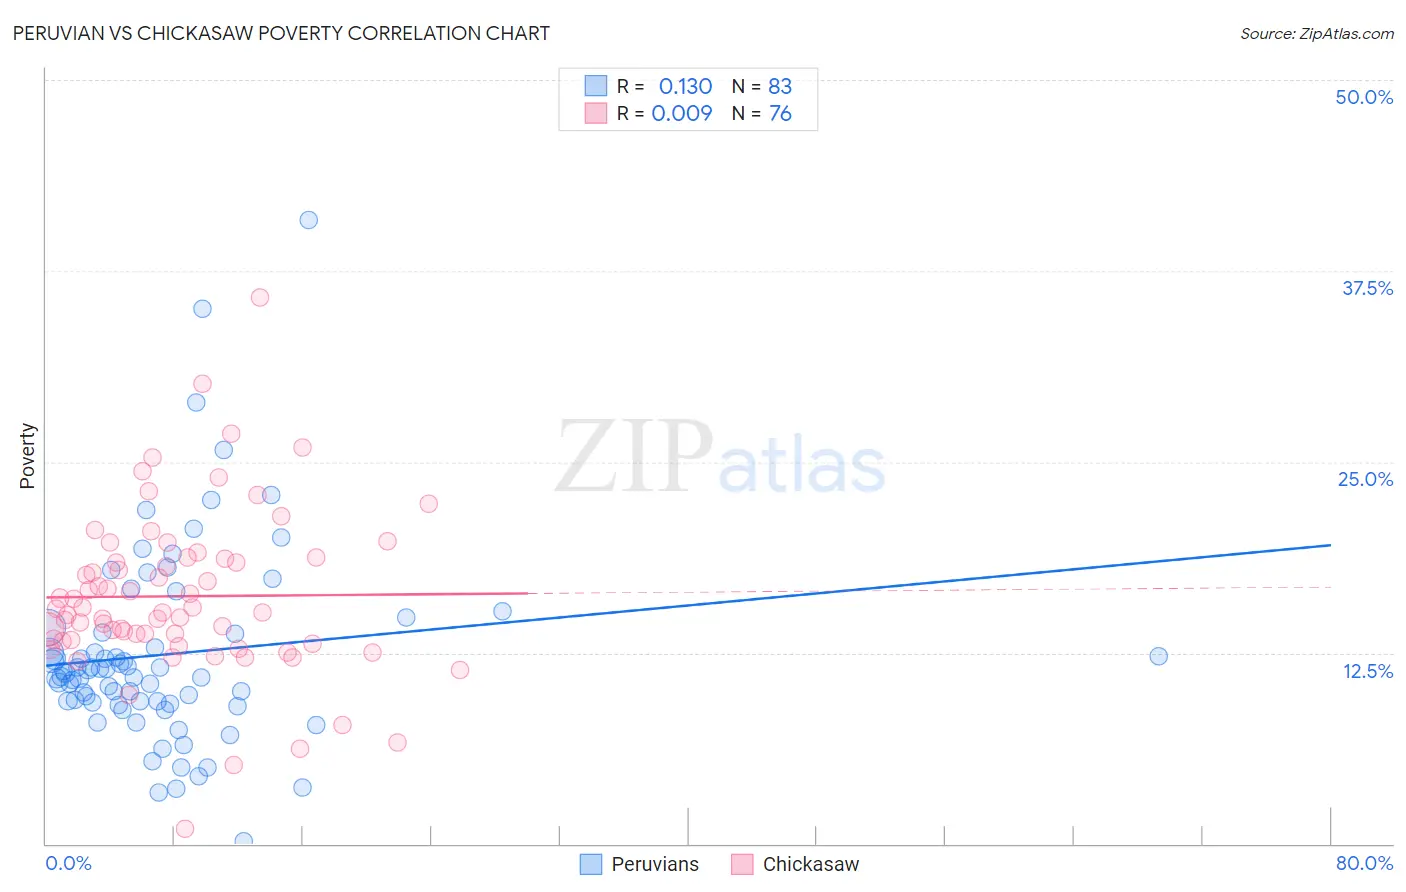
Peruvian vs Chickasaw Poverty Correlation Chart
The statistical analysis conducted on geographies consisting of 363,001,635 people shows a poor positive correlation between the proportion of Peruvians and poverty level in the United States with a correlation coefficient (R) of 0.130 and weighted average of 11.8%. Similarly, the statistical analysis conducted on geographies consisting of 147,672,043 people shows no correlation between the proportion of Chickasaw and poverty level in the United States with a correlation coefficient (R) of 0.009 and weighted average of 14.7%, a difference of 24.5%.
Poverty Correlation Summary
| Measurement | Peruvian | Chickasaw |
| Minimum | 0.14% | 0.99% |
| Maximum | 40.8% | 35.7% |
| Range | 40.7% | 34.7% |
| Mean | 12.4% | 16.2% |
| Median | 11.2% | 15.3% |
| Interquartile 25% (IQ1) | 9.2% | 13.3% |
| Interquartile 75% (IQ3) | 13.8% | 18.7% |
| Interquartile Range (IQR) | 4.6% | 5.4% |
| Standard Deviation (Sample) | 6.5% | 5.4% |
| Standard Deviation (Population) | 6.4% | 5.4% |
Similar Demographics by Poverty
Demographics Similar to Peruvians by Poverty
In terms of poverty, the demographic groups most similar to Peruvians are Immigrants from Western Europe (11.8%, a difference of 0.070%), Yugoslavian (11.8%, a difference of 0.080%), Immigrants from Vietnam (11.8%, a difference of 0.090%), French (11.8%, a difference of 0.11%), and Immigrants from Ukraine (11.8%, a difference of 0.21%).
| Demographics | Rating | Rank | Poverty |
| Immigrants | Brazil | 88.2 /100 | #125 | Excellent 11.7% |
| Immigrants | Norway | 88.0 /100 | #126 | Excellent 11.7% |
| Immigrants | Argentina | 88.0 /100 | #127 | Excellent 11.7% |
| Immigrants | Israel | 87.4 /100 | #128 | Excellent 11.7% |
| South Africans | 87.0 /100 | #129 | Excellent 11.7% |
| Immigrants | Ukraine | 86.6 /100 | #130 | Excellent 11.8% |
| French | 86.1 /100 | #131 | Excellent 11.8% |
| Peruvians | 85.6 /100 | #132 | Excellent 11.8% |
| Immigrants | Western Europe | 85.2 /100 | #133 | Excellent 11.8% |
| Yugoslavians | 85.2 /100 | #134 | Excellent 11.8% |
| Immigrants | Vietnam | 85.2 /100 | #135 | Excellent 11.8% |
| Chileans | 84.2 /100 | #136 | Excellent 11.8% |
| Immigrants | Switzerland | 83.0 /100 | #137 | Excellent 11.8% |
| Immigrants | Jordan | 82.4 /100 | #138 | Excellent 11.9% |
| Pakistanis | 82.2 /100 | #139 | Excellent 11.9% |
Demographics Similar to Chickasaw by Poverty
In terms of poverty, the demographic groups most similar to Chickasaw are Shoshone (14.7%, a difference of 0.040%), Spanish American (14.7%, a difference of 0.53%), Central American (14.6%, a difference of 0.63%), Immigrants from Cuba (14.6%, a difference of 0.77%), and Subsaharan African (14.5%, a difference of 0.92%).
| Demographics | Rating | Rank | Poverty |
| Immigrants | Guyana | 0.1 /100 | #265 | Tragic 14.5% |
| Guyanese | 0.1 /100 | #266 | Tragic 14.5% |
| Iroquois | 0.1 /100 | #267 | Tragic 14.5% |
| Sub-Saharan Africans | 0.1 /100 | #268 | Tragic 14.5% |
| Immigrants | Cuba | 0.1 /100 | #269 | Tragic 14.6% |
| Central Americans | 0.1 /100 | #270 | Tragic 14.6% |
| Shoshone | 0.0 /100 | #271 | Tragic 14.7% |
| Chickasaw | 0.0 /100 | #272 | Tragic 14.7% |
| Spanish Americans | 0.0 /100 | #273 | Tragic 14.7% |
| Barbadians | 0.0 /100 | #274 | Tragic 14.8% |
| Immigrants | West Indies | 0.0 /100 | #275 | Tragic 14.8% |
| Immigrants | Bahamas | 0.0 /100 | #276 | Tragic 14.8% |
| Bangladeshis | 0.0 /100 | #277 | Tragic 14.8% |
| Belizeans | 0.0 /100 | #278 | Tragic 14.8% |
| Immigrants | St. Vincent and the Grenadines | 0.0 /100 | #279 | Tragic 14.9% |