Paraguayan vs Eastern European Single Female Poverty
COMPARE
Paraguayan
Eastern European
Single Female Poverty
Single Female Poverty Comparison
Paraguayans
Eastern Europeans
19.3%
SINGLE FEMALE POVERTY
99.5/ 100
METRIC RATING
69th/ 347
METRIC RANK
19.1%
SINGLE FEMALE POVERTY
99.7/ 100
METRIC RATING
57th/ 347
METRIC RANK
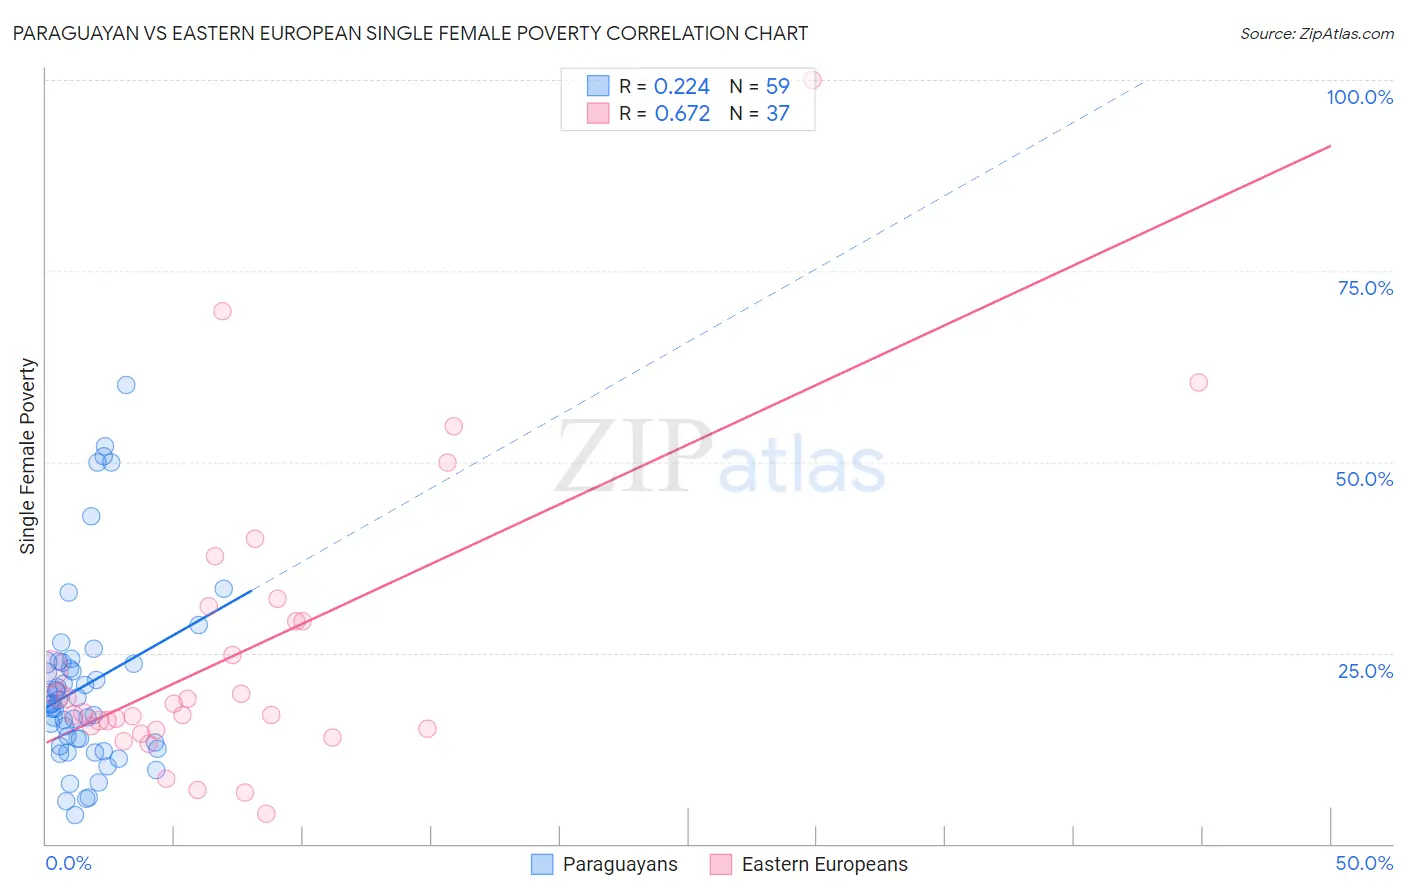
Paraguayan vs Eastern European Single Female Poverty Correlation Chart
The statistical analysis conducted on geographies consisting of 94,675,073 people shows a weak positive correlation between the proportion of Paraguayans and poverty level among single females in the United States with a correlation coefficient (R) of 0.224 and weighted average of 19.3%. Similarly, the statistical analysis conducted on geographies consisting of 449,870,617 people shows a significant positive correlation between the proportion of Eastern Europeans and poverty level among single females in the United States with a correlation coefficient (R) of 0.672 and weighted average of 19.1%, a difference of 0.90%.
Single Female Poverty Correlation Summary
| Measurement | Paraguayan | Eastern European |
| Minimum | 3.7% | 4.0% |
| Maximum | 60.0% | 100.0% |
| Range | 56.3% | 96.0% |
| Mean | 20.7% | 25.3% |
| Median | 18.3% | 17.2% |
| Interquartile 25% (IQ1) | 12.7% | 14.9% |
| Interquartile 75% (IQ3) | 23.7% | 30.1% |
| Interquartile Range (IQR) | 11.0% | 15.2% |
| Standard Deviation (Sample) | 12.1% | 19.6% |
| Standard Deviation (Population) | 12.0% | 19.3% |
Demographics Similar to Paraguayans and Eastern Europeans by Single Female Poverty
In terms of single female poverty, the demographic groups most similar to Paraguayans are Immigrants from Jordan (19.3%, a difference of 0.060%), Immigrants from South Eastern Asia (19.3%, a difference of 0.13%), Immigrants from Latvia (19.3%, a difference of 0.14%), Immigrants from Peru (19.3%, a difference of 0.23%), and Laotian (19.3%, a difference of 0.25%). Similarly, the demographic groups most similar to Eastern Europeans are Immigrants from Fiji (19.1%, a difference of 0.060%), Immigrants from Vietnam (19.1%, a difference of 0.11%), Immigrants from Bulgaria (19.1%, a difference of 0.12%), Argentinean (19.1%, a difference of 0.15%), and Tsimshian (19.1%, a difference of 0.16%).
| Demographics | Rating | Rank | Single Female Poverty |
| Tsimshian | 99.7 /100 | #53 | Exceptional 19.1% |
| Argentineans | 99.7 /100 | #54 | Exceptional 19.1% |
| Immigrants | Vietnam | 99.7 /100 | #55 | Exceptional 19.1% |
| Immigrants | Fiji | 99.7 /100 | #56 | Exceptional 19.1% |
| Eastern Europeans | 99.7 /100 | #57 | Exceptional 19.1% |
| Immigrants | Bulgaria | 99.7 /100 | #58 | Exceptional 19.1% |
| Sri Lankans | 99.6 /100 | #59 | Exceptional 19.2% |
| Russians | 99.6 /100 | #60 | Exceptional 19.2% |
| Cambodians | 99.6 /100 | #61 | Exceptional 19.2% |
| Lithuanians | 99.6 /100 | #62 | Exceptional 19.2% |
| Immigrants | Northern Europe | 99.6 /100 | #63 | Exceptional 19.2% |
| Immigrants | Europe | 99.6 /100 | #64 | Exceptional 19.2% |
| Cypriots | 99.6 /100 | #65 | Exceptional 19.2% |
| Palestinians | 99.6 /100 | #66 | Exceptional 19.2% |
| Immigrants | Egypt | 99.6 /100 | #67 | Exceptional 19.2% |
| Laotians | 99.5 /100 | #68 | Exceptional 19.3% |
| Paraguayans | 99.5 /100 | #69 | Exceptional 19.3% |
| Immigrants | Jordan | 99.4 /100 | #70 | Exceptional 19.3% |
| Immigrants | South Eastern Asia | 99.4 /100 | #71 | Exceptional 19.3% |
| Immigrants | Latvia | 99.4 /100 | #72 | Exceptional 19.3% |
| Immigrants | Peru | 99.4 /100 | #73 | Exceptional 19.3% |