Paraguayan vs Immigrants from Israel Single Female Poverty
COMPARE
Paraguayan
Immigrants from Israel
Single Female Poverty
Single Female Poverty Comparison
Paraguayans
Immigrants from Israel
19.3%
SINGLE FEMALE POVERTY
99.5/ 100
METRIC RATING
69th/ 347
METRIC RANK
18.3%
SINGLE FEMALE POVERTY
100.0/ 100
METRIC RATING
26th/ 347
METRIC RANK
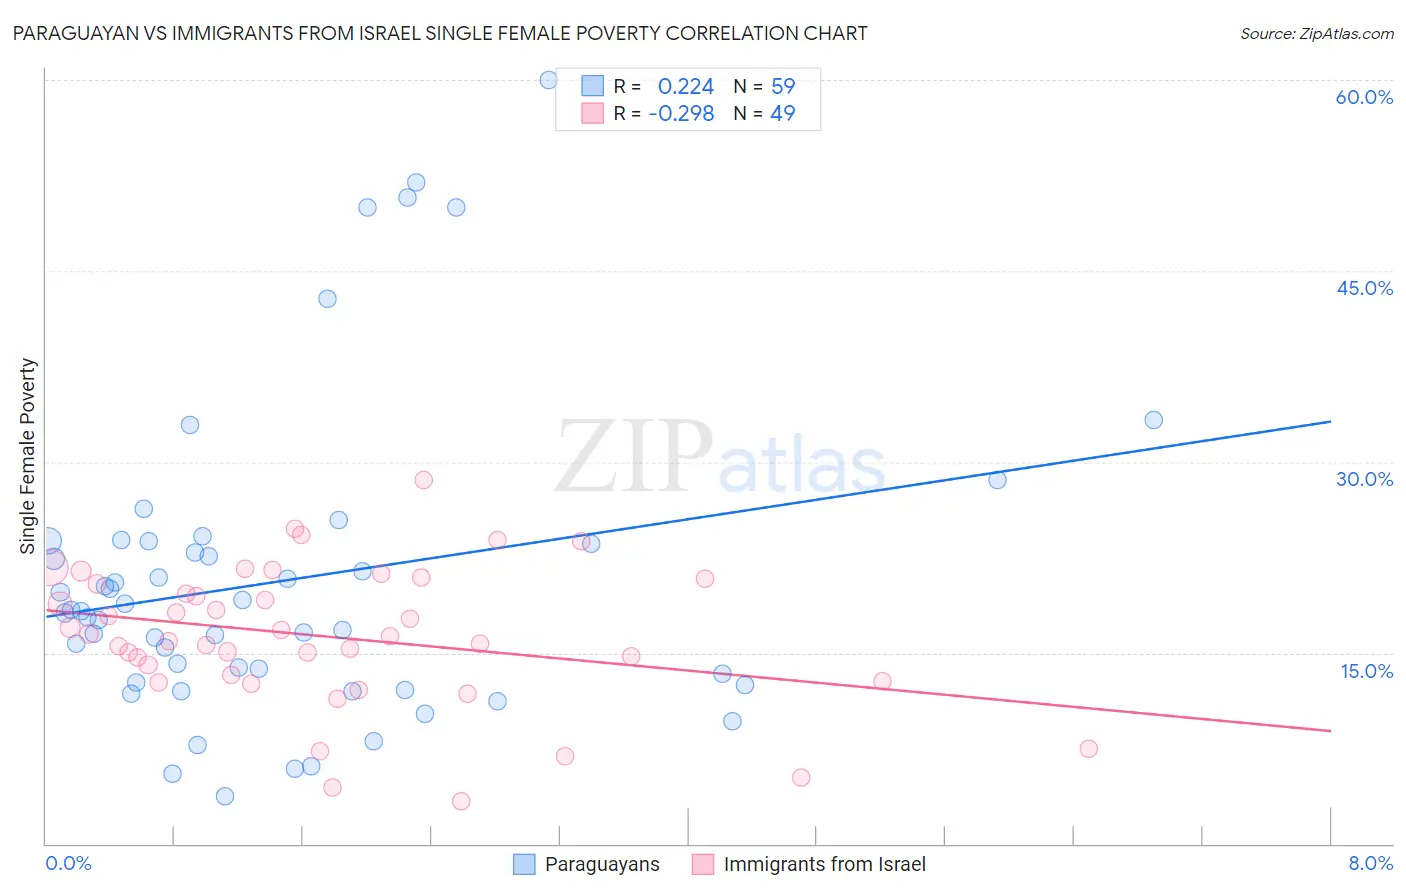
Paraguayan vs Immigrants from Israel Single Female Poverty Correlation Chart
The statistical analysis conducted on geographies consisting of 94,675,073 people shows a weak positive correlation between the proportion of Paraguayans and poverty level among single females in the United States with a correlation coefficient (R) of 0.224 and weighted average of 19.3%. Similarly, the statistical analysis conducted on geographies consisting of 207,619,232 people shows a weak negative correlation between the proportion of Immigrants from Israel and poverty level among single females in the United States with a correlation coefficient (R) of -0.298 and weighted average of 18.3%, a difference of 5.2%.
Single Female Poverty Correlation Summary
| Measurement | Paraguayan | Immigrants from Israel |
| Minimum | 3.7% | 3.3% |
| Maximum | 60.0% | 28.6% |
| Range | 56.3% | 25.2% |
| Mean | 20.7% | 16.3% |
| Median | 18.3% | 16.3% |
| Interquartile 25% (IQ1) | 12.7% | 13.0% |
| Interquartile 75% (IQ3) | 23.7% | 20.6% |
| Interquartile Range (IQR) | 11.0% | 7.6% |
| Standard Deviation (Sample) | 12.1% | 5.5% |
| Standard Deviation (Population) | 12.0% | 5.4% |
Similar Demographics by Single Female Poverty
Demographics Similar to Paraguayans by Single Female Poverty
In terms of single female poverty, the demographic groups most similar to Paraguayans are Immigrants from Jordan (19.3%, a difference of 0.060%), Immigrants from South Eastern Asia (19.3%, a difference of 0.13%), Immigrants from Latvia (19.3%, a difference of 0.14%), Immigrants from Peru (19.3%, a difference of 0.23%), and Laotian (19.3%, a difference of 0.25%).
| Demographics | Rating | Rank | Single Female Poverty |
| Lithuanians | 99.6 /100 | #62 | Exceptional 19.2% |
| Immigrants | Northern Europe | 99.6 /100 | #63 | Exceptional 19.2% |
| Immigrants | Europe | 99.6 /100 | #64 | Exceptional 19.2% |
| Cypriots | 99.6 /100 | #65 | Exceptional 19.2% |
| Palestinians | 99.6 /100 | #66 | Exceptional 19.2% |
| Immigrants | Egypt | 99.6 /100 | #67 | Exceptional 19.2% |
| Laotians | 99.5 /100 | #68 | Exceptional 19.3% |
| Paraguayans | 99.5 /100 | #69 | Exceptional 19.3% |
| Immigrants | Jordan | 99.4 /100 | #70 | Exceptional 19.3% |
| Immigrants | South Eastern Asia | 99.4 /100 | #71 | Exceptional 19.3% |
| Immigrants | Latvia | 99.4 /100 | #72 | Exceptional 19.3% |
| Immigrants | Peru | 99.4 /100 | #73 | Exceptional 19.3% |
| Immigrants | Belarus | 99.4 /100 | #74 | Exceptional 19.3% |
| Immigrants | Turkey | 99.4 /100 | #75 | Exceptional 19.4% |
| Peruvians | 99.4 /100 | #76 | Exceptional 19.4% |
Demographics Similar to Immigrants from Israel by Single Female Poverty
In terms of single female poverty, the demographic groups most similar to Immigrants from Israel are Immigrants from Singapore (18.3%, a difference of 0.020%), Armenian (18.3%, a difference of 0.12%), Immigrants from Pakistan (18.4%, a difference of 0.33%), Burmese (18.3%, a difference of 0.35%), and Asian (18.3%, a difference of 0.35%).
| Demographics | Rating | Rank | Single Female Poverty |
| Immigrants | China | 100.0 /100 | #19 | Exceptional 18.1% |
| Immigrants | Greece | 100.0 /100 | #20 | Exceptional 18.3% |
| Maltese | 100.0 /100 | #21 | Exceptional 18.3% |
| Burmese | 100.0 /100 | #22 | Exceptional 18.3% |
| Asians | 100.0 /100 | #23 | Exceptional 18.3% |
| Armenians | 100.0 /100 | #24 | Exceptional 18.3% |
| Immigrants | Singapore | 100.0 /100 | #25 | Exceptional 18.3% |
| Immigrants | Israel | 100.0 /100 | #26 | Exceptional 18.3% |
| Immigrants | Pakistan | 100.0 /100 | #27 | Exceptional 18.4% |
| Immigrants | Moldova | 100.0 /100 | #28 | Exceptional 18.5% |
| Immigrants | Poland | 100.0 /100 | #29 | Exceptional 18.5% |
| Immigrants | North Macedonia | 99.9 /100 | #30 | Exceptional 18.5% |
| Immigrants | Asia | 99.9 /100 | #31 | Exceptional 18.6% |
| Immigrants | Sri Lanka | 99.9 /100 | #32 | Exceptional 18.6% |
| Immigrants | Philippines | 99.9 /100 | #33 | Exceptional 18.6% |